In a group of 60 students, 38 play basketball, 35 play hockey and 5 do not play either basketball or hockey.
- Draw a Venn diagram to represent the information given. (2 marks)
--- 5 WORK AREA LINES (style=lined) ---
- What percentage of students play both basketball and hockey? (1 mark)
--- 4 WORK AREA LINES (style=lined) ---
Show Answers Only
a.
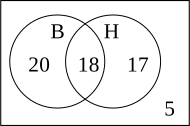
b. \(\text{From the diagram, 18 students play both sports.}\)
\(\text{Percentage}\ = \dfrac{18}{60} \times 100 = 30\%\)
Show Worked Solution
a.
b. \(\text{From the diagram, 18 students play both sports.}\)
\(\text{Percentage}\ = \dfrac{18}{60} \times 100 = 30\%\)