A survey of 60 people found the following information about their exercise habits.
- 35 enjoy hiking \((H)\)
- 28 enjoy cycling \((C)\)
- 8 enjoy neither hiking nor cycling
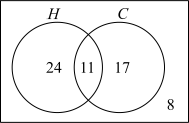
- Draw a Venn diagram to represent this information. (2 marks)
--- 8 WORK AREA LINES (style=lined) ---
- One person is selected at random. What is the probability that the person enjoys hiking or cycling? (1 mark)
--- 3 WORK AREA LINES (style=lined) ---
Show Answers Only
a.
b. \(\dfrac{13}{15}\)
Show Worked Solution
a. \(\text{Number in either }H\text{ or }C = 60-8 = 52\)
\(\text{Number in both }H\text{ and }C = 35+28-52 = 11\)
\(H\text{ only} = 35-11 = 24\)
\(C\text{ only} = 28-11 = 17\)
b. \(P(H \text{ or } C) = \dfrac{24+11+17}{60} = \dfrac{52}{60} = \dfrac{13}{15}\)
\(\text{OR, using the complement:}\)
\(P(H \text{ or } C) = 1-\dfrac{8}{60} = \dfrac{13}{15}\)