Natalie is the supervisor of the Maths club and keeps a record of the number of students in the club at the end of each week.
If no students have left the club, how many joined in Week 3?
- 5
- 7
- 9
- 21
Aussie Maths & Science Teachers: Save your time with SmarterEd
Natalie is the supervisor of the Maths club and keeps a record of the number of students in the club at the end of each week.
If no students have left the club, how many joined in Week 3?
\(A\)
\(\text{Students in club:}\)
\(\text{At the end of week 2 = 16}\)
\(\text{At the end of week 3 = 21}\)
\(\therefore\ \text{Students who joined in week 3}\)
\(=21-16\)
\(=5\)
\(\Rightarrow A\)
Mathew is captain of the drama club and keeps a record of the number of students in the club at the end of each week.
If no students have left the club, how many joined in Week 3?
\(C\)
\(\text{Students in club:}\)
\(\text{At the end of week 2 = 22}\)
\(\text{At the end of week 3 = 33}\)
\(\therefore\ \text{Students who joined in week 3}\)
\(=33-22\)
\(=11\)
\(\Rightarrow C\)
The goals scored by 4 players in a season of soccer were recorded in the graph below.
Simon scored 6 goals in the season.
Gigi scored 3 goals.
How many more goals did Henry score than Fiona? (2 marks)
--- 2 WORK AREA LINES (style=lined) ---
\(7\ \text{goals}\)
\(\text{Since Simon scored 6 goals}\)
\(\longrightarrow\ \text{1 soccer ball = 2 goals}\)
\(\longrightarrow\ \text{Henry scored 8 goals.}\)
\(\longrightarrow\ \text{Fiona scored 1 goals.}\)
| \(\therefore\ \text{Extra goals}\) | \(=8-1\) |
| \(=7\ \text{goals}\) |
The picture graph shows how many tonnes of concrete are needed for 4 jobs.
How many more tonnes of concrete does Job 1 need than Job 3? (2 marks)
--- 2 WORK AREA LINES (style=lined) ---
\(2\ \text{tonnes}\)
\(\text{Job 1 needs 9 tonnes}\)
\(\text{Job 2 needs 7 tonnes}\)
| \(\therefore\ \text{Extra tonnes}\) | \(=9-7\) |
| \(=2\ \text{tonnes}\) |
The bottles in Leisa's fridge are pictured below.

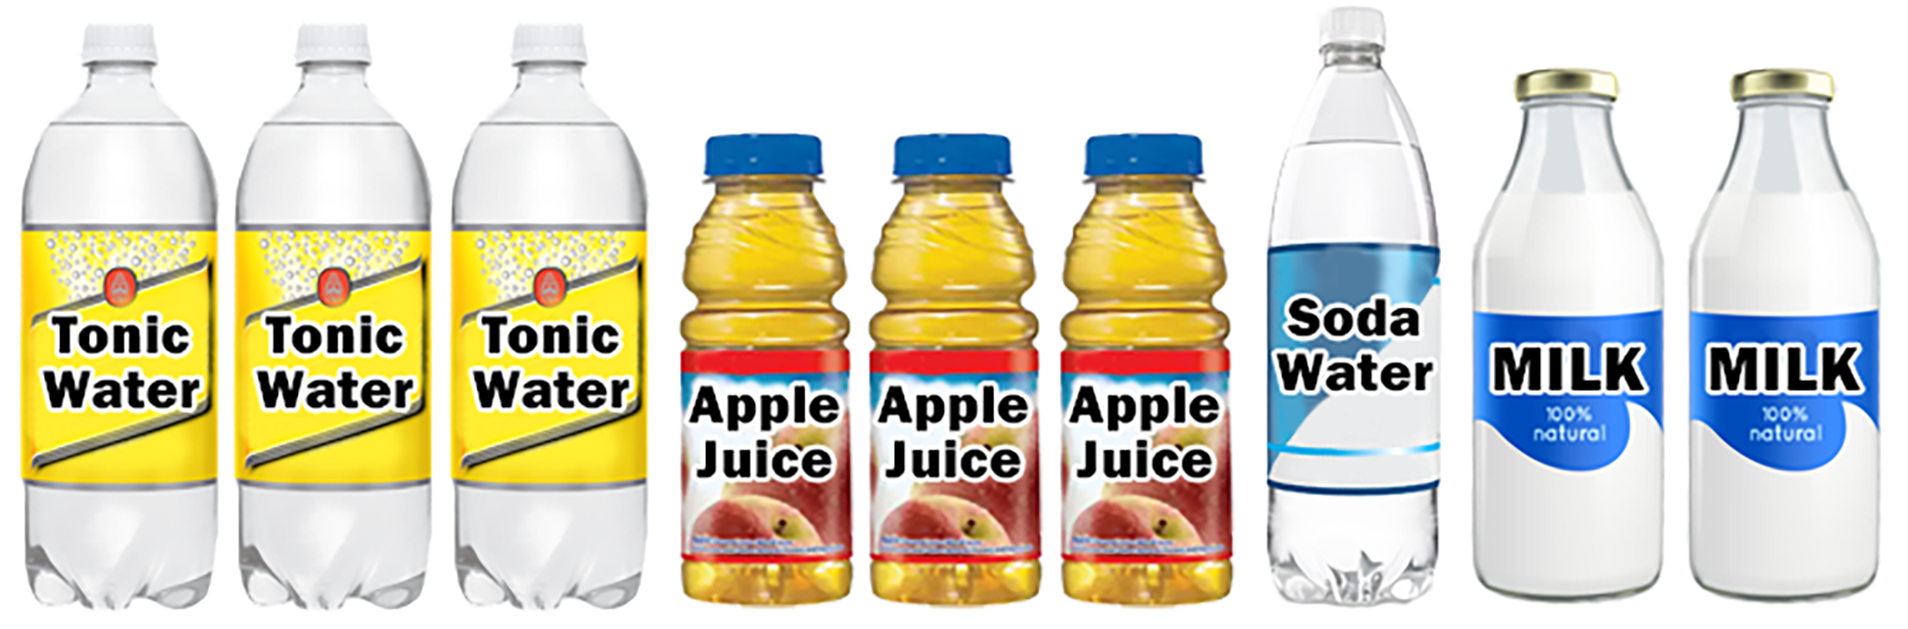
Leisa decides to make a graph where each bar represents one type of bottle in her fridge.
Leisa makes an error when creating the graph.
What should Leisa do to correct the error?
\(D\)
\(\text{Remove the ‘Water’ category since tonic water and}\)
\(\text{soda water are already shown.}\)
\(\Rightarrow D\)
During picking season, four groups of people were hired to pick apples.
A group will receive a bonus if they pick more than 24 apples per person in a 10-minute period.
The table below shows the total amount of apples picked by each group in the first 10 minutes.
Which group would have received a bonus in the first 10-minute period?
\(C\)
\(\text{Calculate apples picked per person (in 10 mins) for each group:}\)
\(\text{A} = 68\ ÷\ 3=22.67\dots\)
\(\text{B} = 95\ ÷\ 4 = 23.75\)
\(\text{C} = 122\ ÷\ 5 = 24.4\)
\(\text{D} = 143\ ÷\ 6 = 23.83\dots\)
\(\Rightarrow C\)
Chris did a survey of the number of female toilets in four shopping centres.
The results were recorded in the table below but the key has been left off the graph?
The total number of female toilets was 44.
| How many toilets does | ![]() |
represent in the graph? |
\(B\)
\(\text{Total number of female symbols}\)
\(=5+4.5+5.5+7\)
\(=22\)
\(\therefore\ \text{The number of toilets one symbol represents}\)
\(=\dfrac{44}{22}\)
\(=2\)
\(\Rightarrow B\)
Each bar on this graph shows the population of a country and the population of its capital city.
The white section is the population that lives in the capital city.
The black section is the population that lives outside the capital city.
Which of the following countries has the highest percentage of its population living in its capital city?
\(B\)
\(\text{Considering the length of the white section of each}\)
\(\text{bar and comparing it to the length of the total bar,}\)
\(\text{Belgium easily has the highest percentage living in}\)
\(\text{its capital city.}\)
\(\Rightarrow B\)
Angus asked all the students in his primary school how far away they lived from school.
He used the results to create the column graph below but left off some labels.
Angus' primary school has 100 students.
How many students lived over 8 km from school? (2 marks)
--- 4 WORK AREA LINES (style=lined) ---
\(18\ \text{students}\)
\(\text{Since there are 5 columns and 100 students, the }\)
\(\text{average number of students per column is 20.}\)
\(\longrightarrow\ \text{Each interval = 4 students}\)
\(\therefore\ \text{Number of students living over 8 km away}\)
\(=4.5\times 4\)
\(=18\ \text{students}\)
Two fishing boats record the number of tuna they catch on four fishing trips.
How many more tuna did Boat 2 catch than Boat 1 in total over the four trips. (2 marks)
--- 5 WORK AREA LINES (style=lined) ---
\(60\)
| \(\text{Boat 1 tuna}\) | \(=140+120+40+55\) |
| \(=355\) |
| \(\text{Boat 2 tuna}\) | \(=105+130+95+85\) |
| \(=415\) |
\(\therefore\ \text{Extra tuna caught by Boat 2}\)
\(=415-355\)
\(=60\)
Students at a high school were surveyed to find whether they did exercise before school.
The graph below shows the results.
There were 150 17-year-old students at the high school.
How many 17-year-old students responded 'Every Day'?
\(C\)
\(\text{30% of 17-year-old students responded ‘Every Day’.}\)
| \(\therefore\ \text{Number}\) | \(=0.3\times 150\) |
| \(=45\) |
\(\Rightarrow C\)
This graph shows a company's profit over a four year period.
Which conclusion can be reached from the graph?
\(B\)
\(\text{Important to note that profits in this table begin at }$25\ 000, \text{not zero.}\)
\(\therefore\ \text{Profits were greater than }$20\ 000 \text{ in the period}\)
\(\text{between Year 1 and Year 4.}\)
\(\Rightarrow B\)
Matt and Libby love nature and planted 50 trees each over 3 weeks.
The bar chart below shows the number of trees each of them planted in each week.
How many more trees did Libby plant than Matt in Week 2. (2 marks)
--- 5 WORK AREA LINES (style=lined) ---
\(5\)
\(\text{Trees planted by Matt in Week 2}\)
\(= 35-15\)
\(= 20\)
\(\text{Trees planted by Libby in Week 2}\)
\(= 45-20\)
\(= 25\)
\(\therefore\ \text{Libby planted 5 more trees than Matt in Week 2.}\)
The graph shows the origin and type of all vehicles in a city.
Which statement is most accurate based on the graph?
\(D\)
\(\text{Consider the 4th option:}\)
\(\text{Total Asian vehicles}\)
\(=5+7+7=19\)
\(\text{Total European vehicles}\)
\(=4+3+3=10\)
\(\therefore\ \text{There are more Asian vehicles than European vehicles.}\)
\(\Rightarrow D\)
Clive and Alvin asked their friends how many books they had read in the past month.
Clive draws a picture graph to show the results for his friends.
Alvin draws a column graph to show the results for his friends.
How many more of Clive's friends read 3-4 books in the last month than Alvin's friends?
\(C\)
\(\text{Number of Clive’s friends}\)
\(=4\times 2\)
\(=8\)
\(\text{Number of Alvin’s friends}\)
\(=2\)
\(\therefore\ \text{6 more of Clive’s friends.}\)
\(\Rightarrow C\)
The school canteen wishes to conduct a survey to find out the preferred sandwich fillings of students so they can ensure they are catering to the likes of the students.
Which of the following survey options would provide the most useful information.
\(D\)
\(\text{Considering each option:}\)
| A. | \(\text{Not representative of the whole school population.}\) |
| B. | \(\text{Not necessary to survey students who do not use the canteen.}\) |
| C. | \(\text{Not representative of the whole school population.}\) |
| D. | \(\text{Students from each year who use the canteen are surveyed,}\) |
| \(\text{so representative of the whole population of canteen users. }\checkmark \) |
\(\Rightarrow D\)
Which of the following would be best conducted as a sample?
\(D\)
\(\text{Considering each option:}\)
\(\text{A. You could measure the all players }\longrightarrow\ \text{Census}\)
\(\text{B. This information would be available from ticket sales }\longrightarrow\ \text{Census}\)
\(\text{C. Could be determined exactly with a stocktake of remaining bottles }\longrightarrow\ \text{Census}\)
\(\text{D. It would not be possible to interview every household to determine popularity }\longrightarrow\ \text{Sample}\)
\(\Rightarrow D\)
Explain the difference between a census and a sample. (2 marks)
--- 2 WORK AREA LINES (style=lined) ---
\(\text{A census surveys the whole population.}\)
\(\text{A sample surveys a section of the population.}\)
\(\text{A census surveys the whole population.}\)
\(\text{A sample surveys a section of the population.}\)
Explain why a door-to-door survey conducted between the hours of 9 am and 3 pm on a Tuesday may not give results representative of the population. (2 marks)
--- 2 WORK AREA LINES (style=lined) ---
\(\text{It would not be representative of the whole community.}\)
\(\text{For example day workers and school children would not be included.}\)
\(\text{It would not be representative of the whole community.}\)
\(\text{For example day workers and school children would not be included.}\)
The local council is researching possible uses for a large area of land close to an established housing development.
One of the options for the land is a football stadium with a crowd capacity of \(30\ 000\) people.
The council is considering surveying people as they exit an existing football stadium in a neighbouring town.
Give a reason why this survey may not provide reliable data. (2 marks)
--- 2 WORK AREA LINES (style=lined) ---
Min is writing a report regarding the capacity of dams in NSW during 2023 projecting in to 2024. He wishes to include rainfall data for the previous 12 months in each of the catchment areas.
Should Min use primary or secondary sources to obtain this informaiton? Give a reason for your answer. (2 marks)
--- 2 WORK AREA LINES (style=lined) ---
\(\text{Secondary Source data}\)
\(\text{Reason: See worked example}\)
\(\text{Secondary source data.}\)
\(\text{It would not be possible for Min to collect this information}\)
\(\text{himself so he would therefore need to rely on already existing}\)
\(\text{secondary source data.}\)
Michael is conducting a survey to determine whether his clients are happy with the customer service they receive at his restaurant.
Should Michael use primary or secondary source data for his survey? Give a reason for your answer. (2 marks)
--- 2 WORK AREA LINES (style=lined) ---
\(\text{Primary Source data}\)
\(\text{Reason: See worked example}\)
\(\text{Primary source data.}\)
\(\text{Michael would survey his actual customers}\)
\(\text{to obtain their opinions and is therefore using}\)
\(\text{primary source data.}\)
Explain the difference between continuous and discrete data, giving an example of each. (3 marks)
--- 4 WORK AREA LINES (style=lined) ---
\(\text{See worked example}\)
\(\text{Discrete can be assigned a numerical value and can}\)
\(\text{usually be counted.}\)
\(\text{Examples could include:} \)
\(\text{Continuous data can be assigned any value in a range}\)
\(\text{and usually involves a measurements.}\)
\(\text{Examples could include:} \)
The following question was asked in a survey.
'What month were you born?'
How would the responses be classified?
\(A\)
\(\text{Months are names and so categorical data and}\)
\(\text{they are ordered}\)
\(\longrightarrow\ \text{Categorical, ordinal.}\)
\(\Rightarrow A\)
Organisers were choosing relay teams for the regional athletics carnival.
They asked the following question.
'What were the times for the 15 Years boys relay teams at zone athletics carnivals?'
How would the responses be classified?
\(D\)
\(\text{The times recorded are measurements}\)
\(\text{so all numbers on the scale are possible}\)
\(\longrightarrow\ \text{Numerical, continuous.}\)
\(\Rightarrow D\)
Which of the following is an example of categorical nominal data?
\(C\)
\(\text{French Bulldog, Poodle and Cavoodle are types of dogs (order not important) }\)
\(\longrightarrow\ \text{categorical nominal}\)
\(\Rightarrow C\)
Which of the following is an example of categorical ordinal data?
\(B\)
\(\text{Small, Medium, Large are categories with an order }\longrightarrow\ \text{categorical ordinal}\)
\(\Rightarrow B\)
Which of the following is an example of numerical continuous data?
\(A\)
\(\text{Weights are measurements (quantitative) }\longrightarrow\ \text{numerical continuous}\)
\(\Rightarrow A\)
Which of the following is an example of numerical discrete data?
\(B\)
\(\text{The number of competitors in a triathlon can be counted }\longrightarrow\ \text{numerical discrete}\)
\(\Rightarrow B\)
State whether the following categorical data is nominal or ordinal.
--- 1 WORK AREA LINES (style=lined) ---
a. \(\text{Ordinal}\)
b. \(\text{Nominal}\)
c. \(\text{Nominal}\)
d. \(\text{Ordinal}\)
a. \(\text{The data is ranked}\ \longrightarrow\ \text{Ordinal}\)
b. \(\text{Colours are the names assigned}\ \longrightarrow\ \text{Nominal}\)
c. \(\text{Preferences are the names assigned}\ \longrightarrow\ \text{Nominal}\)
d. \(\text{Grades rank the data}\ \longrightarrow\ \text{Ordinal}\)
State whether the following data is categorical or numerical. If numerical, state whether discrete or continuous.
--- 1 WORK AREA LINES (style=lined) ---
a. \(\text{Numerical continuous}\)
b. \(\text{Categorical}\)
c. \(\text{Numerical discrete}\)
a. \(\text{Data is a measurement}\ \longrightarrow\ \text{Numerical continuous}\)
b. \(\text{Fruit is grouped into categories or types}\ \longrightarrow\ \text{Categorical}\)
c. \(\text{Students can be counted}\ \longrightarrow\ \text{Numerical discrete}\)
Match each variable with its classification on the right. (2 marks)
\begin{array} {ll} \text{A. Hair colour of students in Year 7} &\text{1. Numerical discrete} \\\text{B. Heights of players in the Boomers basketball team} & \text{2. Categorical ordinal} \\\text{C. The number of people living in each household in NSW}\ & \text{3. Numerical continous}\\\text{D. A, B, C, D, E grades on a report card} & \text{4. Categorical nominal}\end{array}
\(\text{A}\longrightarrow 4,\ \text{B}\longrightarrow 3,\ \text{C}\longrightarrow 1,\ \text{D}\longrightarrow 2\)
\(\text{A. Hair colour is data grouped in categories with no order}\)
\(\therefore\ \text{4. Categorical nominal}\)
\(\text{B. Heights are measurements which are numerical and continuous}\)
\(\therefore\ \text{3. Numerical continous}\)
\(\text{C. The people living in each household are counted}\)
\(\therefore\ \text{1. Numerical discrete}\)
\(\text{D. Grades on a report card are categorical but the order is important}\)
\(\therefore\ \text{2. Categorical ordinal}\)
Classify the following as either categorical or numerical data.
--- 1 WORK AREA LINES (style=lined) ---
a. \(\text{categorical}\)
b. \(\text{numerical}\)
a. \(\text{Colours of cars are words therefore categorical.}\)
b. \(\text{Temperatures are measurements therefore numerical.}\)
Which of the following is not an example of categorical data?
\(D\)
\(\text{Heights are quantitative (measurements) and therefore not categorical.}\)
\(\Rightarrow D\)
What is the term used to describe data that is grouped in categories such as gold, silver and copper? (1 mark)
--- 1 WORK AREA LINES (style=lined) ---
\(\text{Categorical}\)
\(\text{The term for data that is not numerical is categorical.}\)
Brandon made a dot plot to show the hours he worked over the last 16 weeks.
What is the mean number of hours that Brandon worked over that last 16 weeks? (2 marks)
--- 4 WORK AREA LINES (style=lined) ---
\(15.75\ \text{hours}\)
| \(\text{Mean}\ \) | \(=\dfrac{\text{Sum of the scores}}{\text{Number of scores}}\) |
| \(=\dfrac{2\times 13+3\times 14+3\times 15+3\times 16+2\times 17+3\times 19}{16}\) | |
| \(=\dfrac{252}{16}\) | |
| \(=15.75\ \text{hours}\) |
Evie made a dot plot to show the distances she has swum in her training for a long distance ocean swim.
What is the mean distance that Evie has swum? Give your answer correct to 1 decimal place. (2 marks)
--- 4 WORK AREA LINES (style=lined) ---
\(21.6\ \text{km}\)
| \(\text{Mean}\ \) | \(=\dfrac{\text{Sum of the scores}}{\text{Number of scores}}\) |
| \(=\dfrac{18+19+2\times 20+2\times 21+22+3\times 24+25}{11}\) | |
| \(=\dfrac{238}{11}=21.636\dots\) | |
| \(\approx 21.6\ \text{km (1 d.p.)}\) |
The back-to-back ordered stem-and-leaf plot below shows the female and male smoking rates, expressed as a percentage, in 18 countries.
--- 1 WORK AREA LINES (style=lined) ---
--- 4 WORK AREA LINES (style=lined) ---
a. \(30\%\)
b. \(25\%\)
c. \(5.5\%\)
a. \(\text{Range}=47-17=30\%\)
b. \(\text{Female mode}=25\%\)
| c. | \(\text{Female Median }\) | \(=\ \text{average of 9th and 10th scores}\) |
| \(=\dfrac{21+22}{2}=21.5\%\) |
| \(\text{Male Median }\) | \(=\ \text{average of 9th and 10th scores}\) |
| \(=27\%\) |
\(\therefore\ \text{The difference in medians}\)
\(=27-21.5=5.5\%\)
The variables age (under 55 years, 55 years and over) and preferred travel destination (domestic, international) are
\(A\)
\(\text{Age is a categorical ordinal variable}\)
\(\text{because it is categorical data that can}\)
\(\text{have an order.}\)
\(\text{Preferred travel destination is a categorical}\)
\(\text{nominal value because the data has a name.}\)
\(\Rightarrow A\)
The variables blood pressure (low, normal, high) and age (under 50 years, 50 years or over) are
\(B\)
\(\text{Blood pressure is an ordinal variable}\)
\(\text{because it is categorical data that can}\)
\(\text{have an order.}\)
\(\text{Under 50 and over 50, likewise, is an}\)
\(\text{ordinal variable.}\)
\(\Rightarrow B\)
The variables recovery time after exercise (in minutes) and fitness level (below average, average, above average) are
\(D\)
\(\text{Recovery time in minutes → numerical variable}\)
\(\text{Fitness level → ordinal (categories that can be ordered)}\)
\(\Rightarrow D\)
For an ordered set of data containing an odd number of values, the middle value is always
\(B\)
\(\text{For an odd number of values the median is always the middle score.}\)
\(\Rightarrow B\)
The total birth weight of a sample of 12 babies is 39.0 kg.
The mean birth weight of these babies, in kilograms, is
\(D\)
| \(\text{Mean}\) | \(=\dfrac{\text{Total birth weight}}{\text{# babies}}\) |
| \(=\dfrac{39.0}{12}\) | |
| \(=3.25\ \text{kg}\) |
\(\Rightarrow D\)
The total weight of nine oranges is 1.53 kg.
Using this information, the mean weight of an orange would be calculated to be closest to
\(D\)
| \(\text{Mean Weight}\) | \(=\dfrac{\text{Total weight}}{\text{# Oranges}}\) |
| \(=\dfrac{1.53}{9}\) | |
| \(= 0.17\ \text{kg}\) | |
| \(= 170\ \text{g}\) |
\(\Rightarrow D\)
The variables
region (city, urban, rural)
population density (number of people per square kilometre)
\(C\)
\(\text{Region is a categorical variable and population}\)
\(\text{density is a numerical variable (i.e. it can be}\)
\(\text{represented by countable numbers).}\)
\(\Rightarrow C\)
The cube and cylinder below both have the same volume.
--- 3 WORK AREA LINES (style=lined) ---
--- 5 WORK AREA LINES (style=lined) ---
a. \(64\ \text{cm}^3\)
b. \(5.1\ \text{cm (1 d.p.)}\)
| a. | \(V\) | \(=l\times b\times h\) |
| \(=4^3\) | ||
| \(=64\) |
\(\therefore\ \text{The volume of the cube is 64 cm}^3\)
b. \(\text{Diameter = 4 cm}\ \longrightarrow\ \text{Radius = 2 cm}\)
| \(V\) | \(=\pi r^2h\) |
| \(64\) | \(=\pi\times 2^2\times h\) |
| \(64\) | \(=4\pi h\) |
| \(\therefore\ h\) | \(=\dfrac{64}{4\pi}\) |
| \(=5.092\dots\approx 5.1\ \text{(1 d.p.)}\) |
\(\therefore\ \text{The height of the cylinder is approximately 5.1 cm}\)
The cylinder and rectangular prism below both have the same volume.
--- 3 WORK AREA LINES (style=lined) ---
--- 5 WORK AREA LINES (style=lined) ---
a. \(314.16\ \text{cm}^3\ \text{(2 d.p.)}\)
b. \(9.8\ \text{cm (1 d.p.)}\)
a. \(\text{Diameter = 10 cm }\longrightarrow\ \text{Radius = 5 cm}\)
| \(V\) | \(=\pi r^2h\) |
| \(=\pi\times 5^2\times 4\) | |
| \(=314.159\dots\) | |
| \(\approx 314.16\ \text{(2 d.p.)}\) |
\(\therefore\ \text{The volume of the cylinder is approximately 314.16 cm}^3\)
| b. | \(V\) | \(=l\times b\times h\) |
| \(314.16\) | \(=8\times x\times 4\) | |
| \(314.16\) | \(=32x\) | |
| \(\therefore\ x\) | \(=\dfrac{314.16}{32}\) | |
| \(=9.8175\) | ||
| \(\approx 9.8\ \text{(1 d.p.)}\) |
\(\therefore\ \text{The side labelled }x\ \text{is approximately 9.8 cm in length}\)
A half-cylinder has a height of 44 millimetres and a diameter of 20 millimetres. Calculate the volume of the half-cylinder in cubic centimetres, giving your answer as an exact value in terms of \(\pi\). (2 marks)
--- 3 WORK AREA LINES (style=lined) ---
\(2200\pi\ \text{cm}^3\)
\(\text{NOTE: change measurements to centimetres before calculations}\)
| \(V\) | \(=\dfrac{1}{2}\pi r^2h\) |
| \(=\dfrac{1}{2}\times\pi\times 10^2\times 44\) | |
| \(=2200\pi\) |
\(\therefore\ \text{The exact volume of the half-cylinder is }2200\pi\ \text{cm}^3\)
A quarter-cylinder has a height of 160 centimetres and a radius of 800 centimetres . Calculate the volume of the quarter-cylinder in cubic metres, giving your answer as an exact value in terms of \(\pi\). (2 marks)
--- 3 WORK AREA LINES (style=lined) ---
\(25.6\pi\ \text{m}^3\)
\(\text{NOTE: change measurements to metres before calculations}\)
| \(V\) | \(=\dfrac{1}{4}\pi r^2h\) |
| \(=\dfrac{1}{4}\times\pi\times 8^2\times 1.6\) | |
| \(=25.6\pi\) |
\(\therefore\ \text{The exact volume of the quarter-cylinder is }25.6\pi\ \text{m}^3\)
A half-cylinder has a height of 12 centimetres and a radius of 9 centimetres. Calculate the volume of the half-cylinder, giving your answer as an exact value in terms of \(\pi\). (2 marks)
--- 3 WORK AREA LINES (style=lined) ---
\(486\pi\ \text{cm}^3\)
| \(V\) | \(=\dfrac{1}{2}\pi r^2h\) |
| \(=\dfrac{1}{2}\times\pi\times 9^2\times 12\) | |
| \(=486\pi\) |
\(\therefore\ \text{The exact volume of the half-cylinder is }486\pi\ \text{cm}^3\)
A right cylinder has a height of 100 millimetres and a radius of 1.1 millimetres. Calculate the volume of the cylinder, giving your answer as an exact value in terms of \(\pi\). (2 marks)
--- 3 WORK AREA LINES (style=lined) ---
\(121\large\pi\ \)\(\text{mm}^3\)
| \(V\) | \(=\pi r^2h\) |
| \(=\pi\times 1.1^2\times 100\) | |
| \(=121\large\pi\) |
\(\therefore\ \text{The exact volume of the cylinder is }121\large\pi\ \)\(\text{mm}^3\)
A right cylinder has a height of 7 metres and a radius of 4 metres. Calculate the volume of the cylinder, giving your answer as an exact value in terms of \(\pi\). (2 marks)
--- 3 WORK AREA LINES (style=lined) ---
\(112\large\pi\ \)\(\text{m}^3\)
| \(V\) | \(=\pi r^2h\) |
| \(=\pi\times 4^2\times 7\) | |
| \(=112\large\pi\) |
\(\therefore\ \text{The exact volume of the cylinder is }112\large\pi\ \)\(\text{m}^3\)
A right cylinder has a volume of \(11\ 451\) cubic metres. Calculate the radius of the cylinder if the height is 45 metres.
Give your answer to the nearest whole centimetre. (2 marks)
--- 5 WORK AREA LINES (style=lined) ---
\(9\ \text{m}\)
| \(V\) | \(=\pi r^2h\) |
| \(11\ 451\) | \(=\pi\times r^2\times 45\) |
| \(11\ 451\) | \(=10\pi\times r^2\) |
| \(r^2\) | \(=\dfrac{11\ 451}{45\pi}\) |
| \(r^2\) | \(=80.999\dots\) |
| \(r\) | \(=\sqrt{80.999}=8.999\dots\) |
| \(r\) | \(\approx 9\ \text{m (nearest whole m)}\) |
\(\therefore\ \text{The radius of the cylinder is approximately 9 m}\)
A right cylinder has a volume of 22 cubic metres. Calculate the diameter of the cylinder if the height is 7 metres.
Give your answer to the nearest whole metre. (3 marks)
--- 6 WORK AREA LINES (style=lined) ---
\(2\ \text{m}\)
| \(V\) | \(=\pi r^2h\) |
| \(22\) | \(=\pi\times r^2\times 7\) |
| \(22\) | \(=7\pi\times r^2\) |
| \(r^2\) | \(=\dfrac{22}{7\pi}\) |
| \(r^2\) | \(=1.000\dots\) |
| \(r\) | \(=\sqrt{1.000}=1.000\dots\) |
| \(r\) | \(\approx 1\ \text{m (nearest whole m)}\) |
\(\therefore\ \text{The diameter of the cylinder is approximately 2 m}\)
A right cylinder has a volume of 8482.3 cubic millimetres. Calculate the diameter of the cylinder if the height is 12 millimetres.
Give your answer to the nearest whole millimetre. (3 marks)
--- 6 WORK AREA LINES (style=lined) ---
\(30\ \text{mm}\)
| \(V\) | \(=\pi r^2h\) |
| \(8482.3\) | \(=\pi\times r^2\times 12\) |
| \(8482.3\) | \(=12\pi\times r^2\) |
| \(r^2\) | \(=\dfrac{8482.3}{12\pi}\) |
| \(r^2\) | \(=224.999\dots\) |
| \(r\) | \(=\sqrt{224.999}=14.999\dots\) |
| \(r\) | \(\approx 15\ \text{mm (nearest whole mm)}\) |
\(\therefore\ \text{The diameter of the cylinder is approximately 30 mm}\)