SmarterEd

Aussie Maths & Science Teachers: Save your time with SmarterEd

  • Login
  • Get Help
  • About

Displaying Data, SM-Bank 016

The goals scored by 4 players in a season of soccer were recorded in the graph below.
 

Simon scored 6 goals in the season.

Gigi scored 3 goals.

How many more goals did Henry score than Fiona?  (2 marks)

--- 2 WORK AREA LINES (style=lined) ---

Show Answers Only

\(7\ \text{goals}\)

Show Worked Solution

\(\text{Since Simon scored 6 goals}\)

\(\longrightarrow\ \text{1 soccer ball = 2 goals}\)

\(\longrightarrow\ \text{Henry scored 8 goals.}\)

\(\longrightarrow\ \text{Fiona scored 1 goals.}\)
 

\(\therefore\ \text{Extra goals}\) \(=8-1\)
  \(=7\ \text{goals}\)

Filed Under: Displaying Data Tagged With: num-title-ct-core, smc-5076-5-Picture Graphs

Displaying Data, SM-Bank 015

The picture graph shows how many tonnes of concrete are needed for 4 jobs.


How many more tonnes of concrete does Job 1 need than Job 3?  (2 marks)

--- 2 WORK AREA LINES (style=lined) ---

Show Answers Only

\(2\ \text{tonnes}\)

Show Worked Solution

\(\text{Job 1 needs 9 tonnes}\)

\(\text{Job 2 needs 7 tonnes}\)
 

\(\therefore\ \text{Extra tonnes}\) \(=9-7\)
  \(=2\ \text{tonnes}\)

Filed Under: Displaying Data Tagged With: num-title-ct-core, smc-5076-5-Picture Graphs

Displaying Data, SM-Bank 014 MC

The bottles in Leisa's fridge are pictured below.


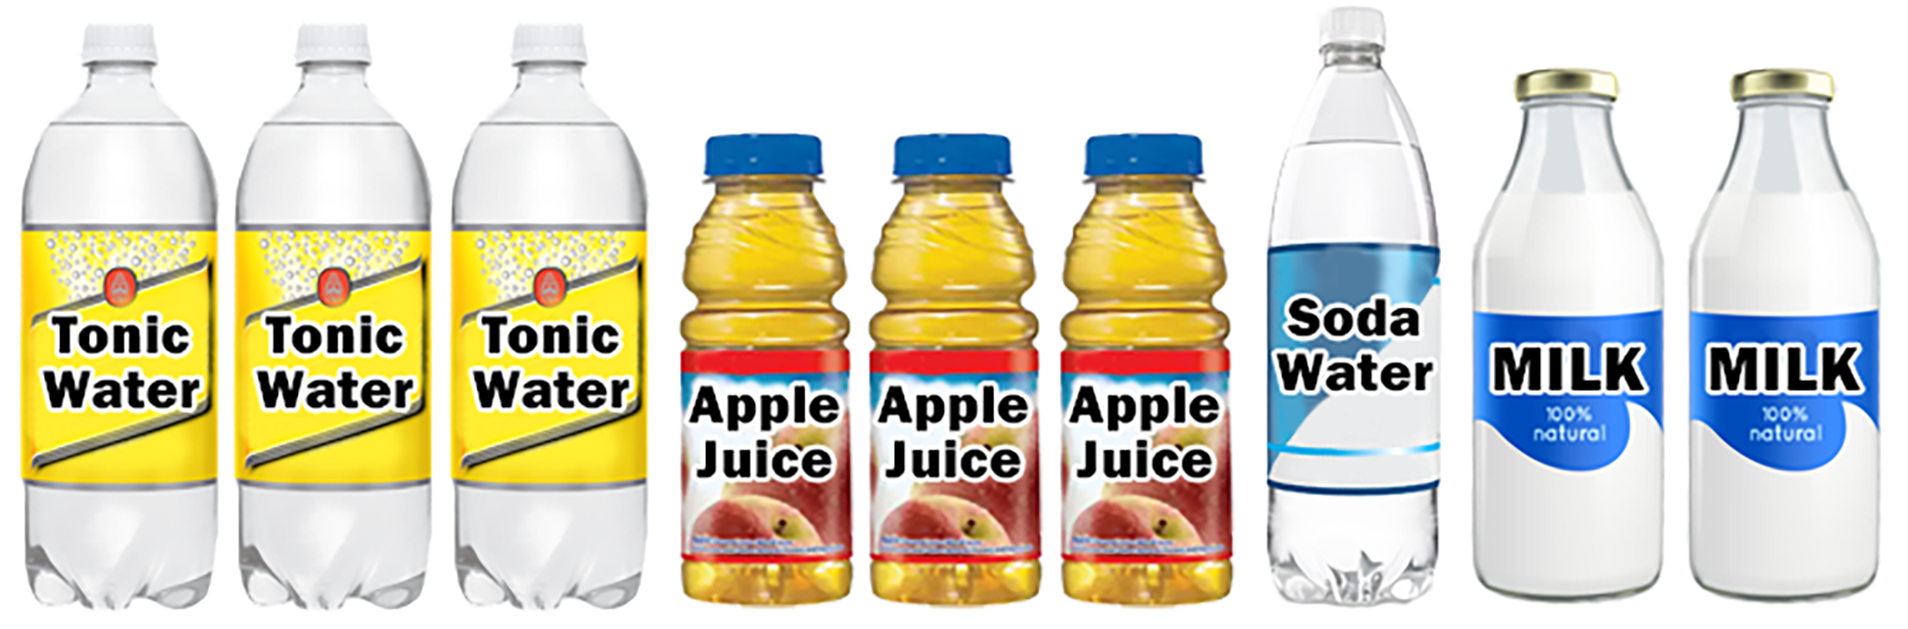
Leisa decides to make a graph where each bar represents one type of bottle in her fridge.


Leisa makes an error when creating the graph.

What should Leisa do to correct the error?

  1. Change the 'Number of bottles' label to 'Volume of bottles'.
  2. Change the title to 'Number of bottles in the fridge by volume'.
  3. The thickness of each bar should vary, depending on the number of bottles.
  4. Remove the 'Water' category since tonic water and soda water are already shown.
Show Answers Only

\(D\)

Show Worked Solution

\(\text{Remove the ‘Water’ category since tonic water and}\)

\(\text{soda water are already shown.}\)

\(\Rightarrow D\)

Filed Under: Displaying Data Tagged With: num-title-ct-core, smc-5076-5-Picture Graphs

Displaying Data, SM-Bank 013 MC

Patrick counts the number of moths he has collected.

  • 9 Bogon moths
  • 3 Atlas moths
  • 6 Gypsy moths

In each picture graph below,  = 3 moths

Select the picture graph that shows the number of moths Patrick counts.

A.   B.
 
C.   D.
 
Show Answers Only

\(A\)

Show Worked Solution
  \(\text{= 3 moths}\)
    \(\text{= 6 moths}\)
     \(\text{= 9 moths}\)


\(\Rightarrow A\)

Filed Under: Displaying Data Tagged With: num-title-ct-core, smc-5076-5-Picture Graphs

Displaying Data, SM-Bank 012 MC

During picking season, four groups of people were hired to pick apples.

A group will receive a bonus if they pick more than 24 apples per person in a 10-minute period.

The table below shows the total amount of apples picked by each group in the first 10 minutes.


Which group would have received a bonus in the first 10-minute period?

  1. Group A
  2. Group B
  3. Group C
  4. Group D
Show Answers Only

\(C\)

Show Worked Solution

\(\text{Calculate apples picked per person (in 10 mins) for each group:}\)

\(\text{A} = 68\ ÷\ 3=22.67\dots\)

\(\text{B} = 95\ ÷\ 4 = 23.75\)

\(\text{C} = 122\ ÷\ 5 = 24.4\)

\(\text{D} = 143\ ÷\ 6 = 23.83\dots\)
 

\(\Rightarrow C\)

Filed Under: Displaying Data Tagged With: num-title-ct-core, smc-5076-5-Picture Graphs

Displaying Data, SM-Bank 011 MC

Chris did a survey of the number of female toilets in four shopping centres.

The results were recorded in the table below but the key has been left off the graph?

The total number of female toilets was 44.

How many toilets does represent in the graph?
  1. 1
  2. 2
  3. 4
  4. 5
Show Answers Only

\(B\)

Show Worked Solution

\(\text{Total number of female symbols}\)

\(=5+4.5+5.5+7\)

\(=22\)
 

\(\therefore\ \text{The number of toilets one symbol represents}\)

\(=\dfrac{44}{22}\)

\(=2\)

 
\(\Rightarrow B\)

Filed Under: Displaying Data Tagged With: num-title-ct-core, smc-5076-5-Picture Graphs

Displaying Data, SM-Bank 002 MC

Clive and Alvin asked their friends how many books they had read in the past month.

Clive draws a picture graph to show the results for his friends.

Alvin draws a column graph to show the results for his friends.


How many more of Clive's friends read 3-4 books in the last month than Alvin's friends?

  1. 0
  2. 4
  3. 6
  4. 8
Show Answers Only

\(C\)

Show Worked Solution

\(\text{Number of Clive’s friends}\)

\(=4\times 2\)

\(=8\)

\(\text{Number of Alvin’s friends}\)

\(=2\)

\(\therefore\ \text{6 more of Clive’s friends.}\)

\(\Rightarrow C\)

Filed Under: Displaying Data Tagged With: num-title-ct-core, smc-5076-10-Column graphs and histograms, smc-5076-5-Picture Graphs

Copyright © 2014–2025 SmarterEd.com.au · Log in