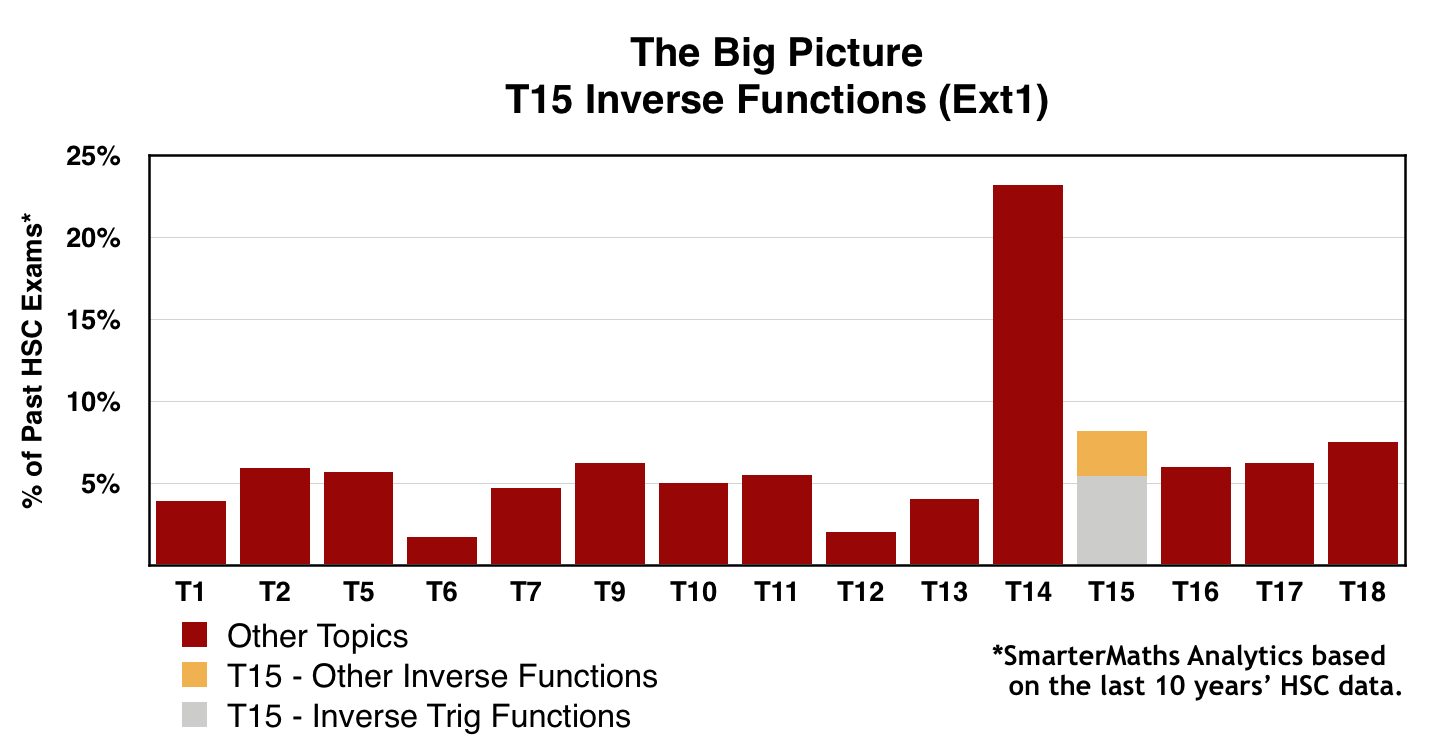
HISTORICAL CONTRIBUTION
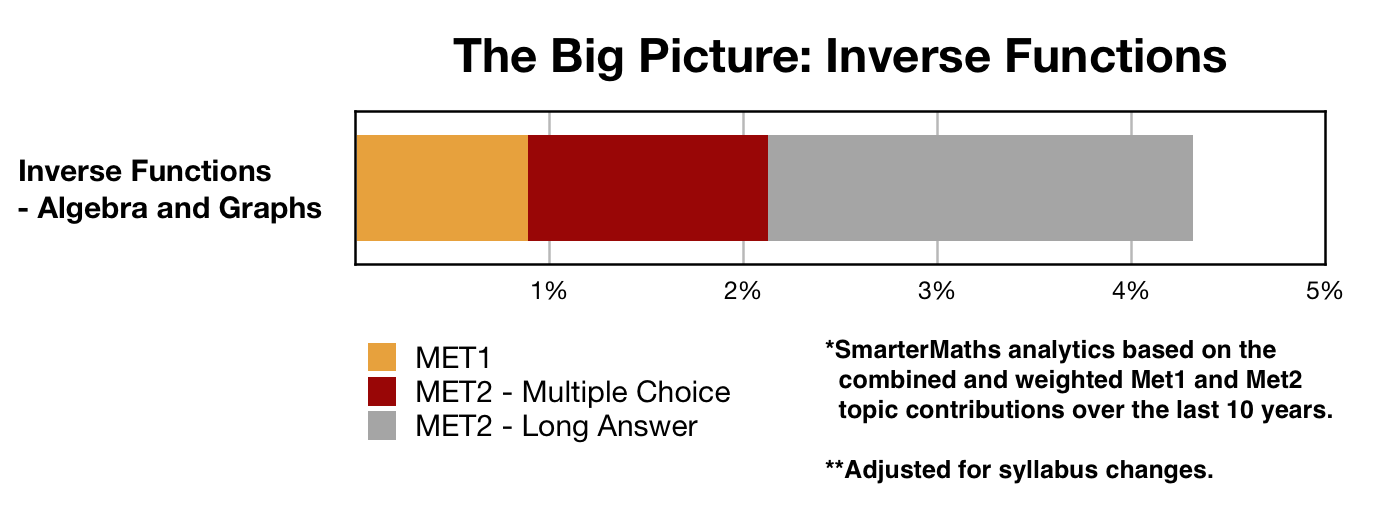
- Inverse Functions (4.3%) is a significant contributing sub-topic to the broad Algebra, Functions and Graphs (29.1%) area of study.
VCE ANALYSIS - What to expect and common pitfalls
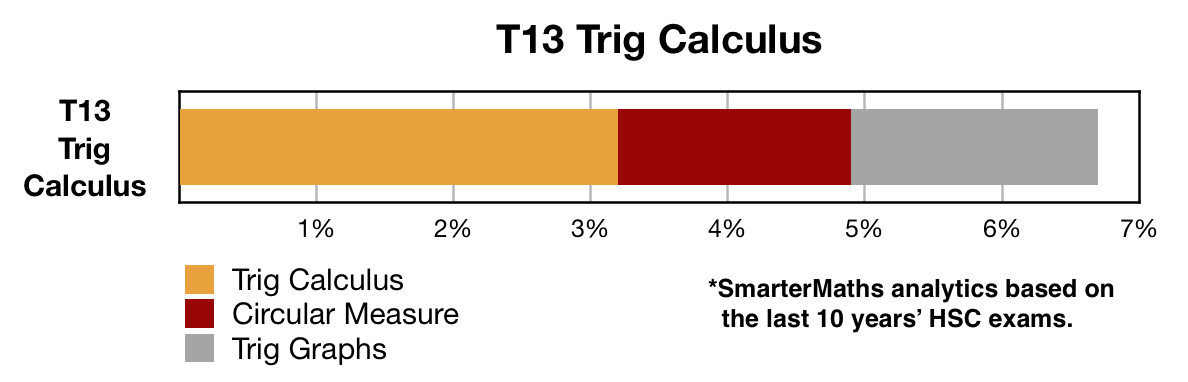
- Inverse Functions (4.3%) includes all inverse function algebra and graphs
- Met1 exam - Inverse Functions was last examined in the Met1 exam in 2016, where it was allocated 3 marks and poorly answered (2016 Met1 Q5b), increasing the likelihood of it being retested sooner, in our view.
- The most common pitfall for students is related to domain restrictions and a number of past exam questions provide great revision for this concept.
- Met2 Multiple Choice - Inverse Functions have been examined in this section in 8 of the last 9 years, with more than one question appearing half the time.
- Although the multiple choice questions have typically been well answered, a few notable exceptions caused students problems and are worthy of careful attention (see 2013 Met2 7 MC, 2015 Met2 2 MC, and 2014 Met2 6 MC).
- Met2 Longer Answer - Inverse Functions were examined in the Met2 longer answer section in both 2016 and 2017, after not appearing in this section the previous 4 years.
- Historically, students have scored well in this topic area and when it is examined, the mark allocations have been meaningful at 2-8 marks.
- Note that examiners regularly ask for the intersection a graph and its inverse. Understand why this is most easily be found by finding the graph's intersection with the line `y=x`.


