SmarterEd

Aussie Maths & Science Teachers: Save your time with SmarterEd

  • Login
  • Get Help
  • About

2UA Snapshot – T9

HISTORICAL CONTRIBUTION

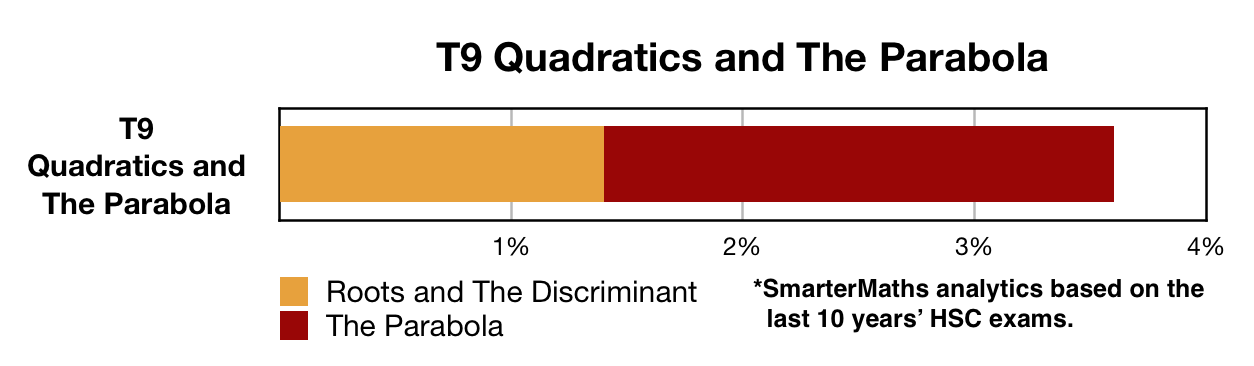
  • T9 Quadratics and the Parabola is a relatively small but nonetheless important topic, contributing an average of 3.6% to each exam over the past 10 years.
  • This topic has been split into two sub-categories for analysis purposes which are: 1-Roots and the Discriminant (1.4%), and 2-The Parabola (2.2%).

HSC ANALYSIS - What to expect and common pitfalls

  • Quadratic Roots have been examined in 2014, 2012 and 2011, typically in questions worth 3 marks. After 4 years with no dedicated question, we see a high likelihood of this area being examined in 2019.
  • The Discriminant was examined in 2015 and has been asked around once every 3 years in recent times. The difficulty level of questions on this sub-topic has varied from straight forward (2009 Q4b) to extremely difficult (2012 Q16c).
  • The Parabola (2.2%) is examined every year, but was allocated just 1 mark in 2018 and 2017. In general, this topic area is well answered although the 2018 multiple choice caused major problems (mean mark just 16%!) and deserves attention.
  • Students confident in working with focus, vertex and directrix calculations should score highly (Marker's Comment: students who draw a sketch, even when not required, make less errors).
  • Equations reducible to quadratics rarely receive a dedicated question, although 2017 turned up the first in a decade. It remains important to any revision however, as it often appears within harder cross-topic questions.

Filed Under: Roots and the discriminant, The Parabola Tagged With: worksheet-preamble

2UA Snapshot – T7 Parent

HISTORICAL CONTRIBUTION

  • T7 Series and Applications is a huge contributor to the Mathematics HSC exam, accounting for an average of 11.5% per year over the last decade.
  • This topic has been split into three sub-categories for analysis purposes which are: 1-Arithmetic Series (2.6%), 2-Geometric Series (3.5%), and 3-Loans and Annuities (5.4%).

HSC ANALYSIS - What to expect and common pitfalls

  • Arithmetic Series (2.6%) has proven to be a great topic area to score highly, with the notable exceptions of 2018 Q14d and 2013 Q12c where a combination of arithmetic and geometric series caused significant problems - these deserve attention.
  • Geometric Series (3.5%) questions are reliably tested at least once every year, and should always be given a revision focus.
  • Testing the "sum to infinity" within the Geometric Series has been an examiner favourite, appearing in 7 out of the last 9 papers, notably absent in 2018.
  • Loans and Annuities (5.4%) are examined every year like clockwork and are always worth significant marks. Students can reliably expect a question worth between 5-8 marks, with easier marks available in earlier parts.

Filed Under: Arithmetic Series, Compound interest, loan repayments and annuities, Geometric Series Tagged With: worksheet-preamble

2UA Snapshot – T7 Loans and Annuities

HISTORICAL CONTRIBUTION

  • T7 Series and Applications is a huge contributor to the Mathematics HSC exam, accounting for an average of 11.5% per year over the last decade.
  • This topic has been split into three sub-categories for analysis purposes which are: 1-Arithmetic Series (2.6%), 2-Geometric Series (3.5%), and 3-Loans and Annuities (5.4%).

HSC ANALYSIS - What to expect and common pitfalls

  • Loans and Annuities (5.4%) are examined every year like clockwork and are always worth significant marks. Students can reliably expect a question worth between 5-8 marks. 
  • Loans versus Annuity questions are equally likely to be examined by historical analysis. Examiners have also combined elements of both in the same question (eg. an account accumulating interest and also receiving withdrawals) as they did in both 2018 and 2017.
  • Although an extremely challenging topic area, examiners consistently offer very achievable marks in the earlier part(s) of questions.
  • Pitfalls: Marker's Comments - Good setting out and clear handwriting is at a premium in this topic area with messy working a major contributor to errors. Students who develop formula proofs from `A_1` to `A_2` through to `A_n` are the most successful.
  • Well prepared students will find question structures reasonably predictable. Effective revision requires students to do plenty of examples. High scoring within this sub-topic regularly differentiates the higher band papers.

Filed Under: Compound interest, loan repayments and annuities Tagged With: worksheet-preamble

2UA Snapshot – T7 GPs

HISTORICAL CONTRIBUTION

  • T7 Series and Applications is a huge contributor to the Mathematics HSC exam, accounting for an average of 11.5% per year over the last decade.
  • This topic has been split into three sub-categories for analysis purposes which are: 1-Arithmetic Series (2.6%), 2-Geometric Series (3.5%), and 3-Loans and Annuities (5.4%).

HSC ANALYSIS - What to expect and common pitfalls

  • Geometric Series (3.5%) questions are reliably tested at least once every year, and should always be given a revision focus.
  • Although generally well answered, note that sub-50% mean marks have resulted in 4 of the past 6 years. The summing of a series that incorporated both and arithmetic and geometric elements in 2018 Q14d caused major problems and warrants attention.
  • Testing the "sum to infinity" within the Geometric Series has been an examiner favourite, appearing in 7 out of the last 9 papers, notably absent in 2018. The 2017 exam required a deep understanding of this concept, caused major difficulties and should be reviewed closely.
  • "Sum to infinity" within Geometric Series is a natural cross topic partner with Probability. Worthy of particular note that the last time this type of question was examined, it proved extremely challenging for many students (2013 Q15d).

Filed Under: Geometric Series Tagged With: worksheet-preamble

2UA Snapshot – T7 APs

HISTORICAL CONTRIBUTION

  • T7 Series and Applications is a huge contributor to the Mathematics HSC exam, accounting for an average of 11.5% per year over the last decade.
  • This topic has been split into three sub-categories for analysis purposes which are: 1-Arithmetic Series (2.6%), 2-Geometric Series (3.5%), and 3-Loans and Annuities (5.4%).

HSC ANALYSIS - What to expect and common pitfalls

  • Arithmetic Series (2.6%) has proven to be a great topic area to score highly, with the notable exceptions of 2018 Q14d and 2013 Q12c where a combination of arithmetic and geometric series caused significant problems - these deserve attention.
  • This topic area is often examined through pure calculation, numerical examples (as seen in 2018, 2017, 2015 and 2014). However, an equally common question-type has required students to interpret a narrative which tests both their comprehension and mathematical skills. Good revision should emphasise these narrative-style questions.
  • Pitfalls: Examiners often require students to use the sum of an arithmetic series formula to create and then solve a quadratic in `n`. Students need to solve and interpret the solutions in this situation (such as ignoring negative values).

Filed Under: Arithmetic Series Tagged With: worksheet-preamble

2UA Snapshot – T6 Linear

HISTORICAL CONTRIBUTION

  • T6 Linear Functions are examined every year without fail, and have been worth a very significant 6.5% of the HSC paper, on average, over the past decade.
  • This topic area, along with Topic 1, represents the land of low lying fruit within the Mathematics course.

HSC ANALYSIS - What to expect and common pitfalls

  • Expect a multi-part number plane question worth at least 4 marks, and an additional multiple choice question (asked every year since multiple choice has been included in the exam, except 2016).
  • The 2018 HSC exam is an outlier in not including a high-mark number plane question. This was very surprising and highly unlikely to be repeated in 2019, in our view.
  • Marker's Comments of note: too many students make errors in quoting and applying the perpendicular distance formula.
  • This topic area provides well prepared students with a prime opportunity to score highly in an area with a significant mark allocation and get ahead of the clock in the exam. Minimising errors and developing speed, in that order, should be clear priorities in revising this topic.

Filed Under: 6. Linear Functions Tagged With: worksheet-preamble

2UA Snapshot – T5 Parent

HISTORICAL CONTRIBUTION

  • T5 Trig Ratios has been worth a substantial 5.4% of the HSC exam in the last 10 years.
  • This topic has been split into two sub-categories which are: 1-Exact Trig Ratios and Other Identities (2.4%), and 2-Sine, Cosine Rules and Bearings (3.0%).

HSC ANALYSIS - What to expect and common pitfalls

  • Exact Trig Ratios and Other Identities has been examined at least once each year (notably 3 times in 2016) in questions of varying difficulty, producing sub-50% mean marks in 4 out of the last 6 years.
  • The most common question type gives a simple trig equation and asks students to answer in exact radian form, within a specified range (Marker's Comments have highlighted that this is often poorly understood).
  • Sine, Cosine Rules and Bearings (3.0%) have seen an uptick in mark allocation in recent times, appearing in the last 7 HSC exams. This sub-topic was allocated a whopping 6 marks in 2018 and 3 marks in 2017.
  • This area is commonly examined in a vanilla apply the formula style problem - although be careful here as a majority of students had difficulties in both 2015 Q13a and 2013 Q14c, (sub-50% mean marks resulted in both years).
  • Bearings was most recently tested in 2018 and 2014 in a chunky 5-mark question (its 2014 appearance was its first in a decade).

Filed Under: Exact Trig Ratios and Other Identities, Sine and Cosine Rules, Bearings Tagged With: worksheet-preamble

2UA Snapshot – T5 Sine Cosine

HISTORICAL CONTRIBUTION

  • T5 Trig Ratios has been worth a substantial 5.4% of the HSC paper over the past 10 years.
  • This topic has been split into two sub-categories which are: 1-Exact Trig Ratios and Other Identities (2.4%), and 2-Sine, Cosine Rules and Bearings (3.0%).
  • This analysis looks at Sine, Cosine Rules and Bearings.

HSC ANALYSIS - What to expect and common pitfalls

  • Sine, Cosine Rules and Bearings (3.0%) have seen an uptick in mark allocation in recent times, appearing in the last 7 HSC exams. This sub-topic was allocated a whopping 6 marks in 2018 and 3 marks in 2017.
  • This area is commonly examined in a vanilla apply the formula style problem - although be careful here as a majority of students had difficulties in both 2015 Q13a and 2013 Q14c, (sub-50% mean marks resulted in both years).
  • It is also regularly tested in longer answer cross-topic questions and most commonly partnered with Circular Measure (sector calculations), although a number of other topics are possible.
  • Bearings was most recently tested in 2018 and 2014 in a chunky 5-mark question (its 2014 appearance was its first in a decade).

Filed Under: Sine and Cosine Rules, Bearings Tagged With: worksheet-preamble

2UA Snapshot – T5 Exact Ratios and Identities

HISTORICAL CONTRIBUTION

  • T5 Trig Ratios has been worth a substantial 5.4% of the HSC paper over the past 10 years.
  • This topic has been split into two sub-categories which are: 1-Exact Trig Ratios and Other Identities (2.4%), and 2-Sine, Cosine Rules and Bearings (3.0%).
  • This analysis looks at Exact Trig Ratios and Other Identities.

HSC ANALYSIS - What to expect and common pitfalls

  • Exact Trig Ratios and Other Identities has been examined at least once each year (notably 3 times in 2016) in questions of varying difficulty, producing sub-50% mean marks in 4 out of the last 6 years.
  • The most common question type gives a simple trig equation and asks students to answer in exact radian form, within a specified range (Marker's Comments have highlighted that this is often poorly understood).
  • This topic area is very well suited to cross-topic examination and has regularly been part of larger questions covering a broad range of topics such as integration, series and trig calculus. 

Filed Under: Exact Trig Ratios and Other Identities Tagged With: worksheet-preamble

2UA Snapshot – T4

HISTORICAL CONTRIBUTION

  • T4 Real Functions is a small topic area in the Mathematics syllabus that has contributed an average of 3.0% to the HSC paper over the last 10 years.
  • Although small, this topic surprised in the 2017 and 2016 exams 4-mark allocations (from 3 seperate questions on each occasion).

HSC ANALYSIS - What to expect and common pitfalls

  • The most commonly asked questions within T4 Real Functions test graphic representations of inequalities and other regions, and students' knowledge of domain restrictions in certain functions.
  • Note that the graphic representation of an odd function was poorly answered in 2016 and should be reviewed.
  • Knowledge of circle equations has been popular with examiners in recent times, appearing in the paper in 7 out of the last 9 years (including 2018).
  • Marker's Comments of note: Draw diagrams large and use a ruler and a consistent scale where possible. Good advice consistently stated. Follow it.

Filed Under: 4. Real Functions Tagged With: worksheet-preamble

2UA Snapshot – T3

HISTORICAL CONTRIBUTION

  • T3 Probability has contributed an average of 5.0% of the Mathematics HSC paper over the last 10 years.
  • Exam trends have shown that you can expect to be asked two questions on probability that are likely to differ in their level of difficulty significantly (although 2018 had 3 questions and 2017 had just the one 4-mark question). 

HSC ANALYSIS - What to expect and common pitfalls

  • Past HSC cohorts have found this topic area very challenging with around half the questions examined producing sub-50% mean marks (2018 was a particularly tough year).
  • Tree diagrams can often be useful in answering probability questions and were specifically examined in 2014 and 2015, but notably absent for the last 3 years. An area well worth a revision focus - note the slightly different tree diagram required in 2008 Q7c and the Marker's Comment.
  • Critical to recognise opportunities to apply complementary probability where  P(E) = 1 - P(complement) - a concept that is consistently examined.
  • Probability was combined with the Series and Sequence topic in 2013 and 2016, and terribly answered on both occasions! A sum to infinity can easily be incorporated into a probability question, so make sure you cover and understand these examples.

Filed Under: 3. Probability Tagged With: worksheet-preamble

2UA Snapshot – T2

HISTORICAL CONTRIBUTION

  • T2 Plane Geometry has had the lowest mean marks of any topic since individual question data has been available and has contributed an average of 6.2% per exam.
  • Plane Geometry is asked every year and is always given a substantial mark allocation. Ominously, 2018 posed the simplest question in this area for many years - this is unlikely to be the case in 2019, in our view.

HSC ANALYSIS - What to expect and common pitfalls

  • Although Plane Geometry has proven very challenging in the past, there is a predictability that can work for students. In every year since 2009, examiners have asked students to prove similarity and utilise the ratio property of corresponding sides to prove a further algebraic relationship.
  • Proving similarity in this question type has typically been worth 2 full marks and is where most students will find the easiest opportunity to score.
  • Proofs in the latter parts of questions have been extremely challenging but students are reminded that the starting point is almost always utilising the ratio property of corresponding sides.
  • It cannot be emphasised enough: the substantial mark allocations and consistently low mean marks in this topic area make it crucial in obtaining band 5 and band 6 results.

Filed Under: 2. Plane Geometry Tagged With: worksheet-preamble

2UA Snapshot – T1

HISTORICAL CONTRIBUTION

  • T1 Basic Arithmetic and Algebra is the land of low hanging fruit in the Mathematics exam. It has the highest average mean mark of any topic and has accounted for an average of 5.4% per exam over the last decade.
  • This analysis has split the topic into 3 categories: 1-Surds and Rounding, 2-Absolute Values and Inequalities, and 3-Factorisation and Other Equations.

HSC ANALYSIS - What to expect and common pitfalls

  • Surds and Rounding (2.0%) is most commonly tested with surds - examined in 2 out of every 3 years (including 2018).
  • Rounding questions can require students to know standard decimal place rounding, significant figures (2011-14) and scientific notation (2015). HSC Marker's comment - write down answers to an adequate number of figures before rounding!
  • Absolute Value and Inequality (1.4%). Absolute value was last tested in a dedicated question in 2017 and 2016 (omitted 2018). Inequalities were examined in 2018 (first time since 2011) and well answered.
  • Factorisation and Other Equations (2.0%) have seen a recent uptick in their contribution. Cubic factorisation is the most common question style. Eliminating silly mistakes is the only barrier to scoring very highly here.

Filed Under: Factors and Other Equations, Inequalities and Absolute Values, Surds and Rounding Tagged With: worksheet-preamble

2UG Snapshot FS Health

HISTORICAL CONTRIBUTION

  • Focus Study: Health has been a very well tested area in the past few HSC papers, particularly in the further application of content within Linear Relationships (AM4) and Measurement (MM1).
  • A surprisingly large allocation of 9 marks in both 2015 and 2016 (and 5 in 2017) make this focus study an extremely important revision topic area.

PAST HSC ANALYSIS - What to expect and common pitfalls

  • The focus study is split into the following three sub-topics: 1-Body Measurements, 2-Medication, and 3-Life Expectancy. 
  • Body Measurements and Life Expectancy has been the applied focus of "Linear Relationship (AM4)" content in multi-part questions in 4 of the last 5 years (not 2017). These questions have proven challenging but also predictable. Common pitfalls highlighted by markers include finding the equations of best fit, interpreting gradients and identifying limitations of an equation. 
  • Medication's importance in the current syllabus is evidenced by the fact it has been examined in each of the past 4 years, and twice in both 2014 and 2015. It has been tested via a simple formula substitution question or a more involved units of measurement problem. This area borrows heavily from "Units of Measurement (MM1)" content and provides a great opportunity for scoring highly.
  • Note that Correlation, within FS Health, has been examined and poorly answered in 2017, 2016 and 2015. Particular attention should be paid to the correlation co-efficient in the formula sheet within an examinable context, which has been asked in the last two exam papers.

Filed Under: Correlation / Body Measurements, Life Expectancy, Medication Tagged With: worksheet-preamble

2UG Snapshot FS – Resources

HISTORICAL CONTRIBUTION

  • Focus Study: Resources has been examined meaningfully in its short existence, although a majority of the marks attributed to the focus study in the last 4 years is simply a further application of Measurement strand content.
  • Analysing the short history of this focus study definitely sheds some light on where revision should be targeted and the following points are worthy of note.

PAST HSC ANALYSIS - What to expect and common pitfalls

  • The focus study is split into the following three sub-topics: 1-Water availability and usage, 2-Dams, land and catchment areas, and 3-Energy and sustainability. 
  • Dams, land and catchment areas has been the most examined area. It has been tested exclusively through questions involving Simpson's Rule (overlapping with MM4) in recent history and deserves attention primarily due to its historically high allocated marks. Classic low hanging fruit.
  • Energy and sustainability has been asked within an electricity usage context in each of the last 4 years. This area is topical and the trend is likely to continue in our view. The 2015 question on this topic (30a) produced the lowest mean mark in this area of 49%, and should be reviewed.
  • Water availability and usage is typically examined through calculations of tank volumes, which also fit neatly into the Measurement strand (MM4). 

Filed Under: FS Resources Tagged With: worksheet-preamble

2UG Snapshot FS Communications

HISTORICAL CONTRIBUTION

  • Focus Study: Communications had not been examined in any significant way before 2015. Since then it has been allocated a significant 5 marks in 2017 and 2016, and 6 marks in 2015.
  • A very small database of past questions make HSC analysis of this area difficult. However, the surprisingly large mark allocation of the past three years make it a very important focus for revision.

PAST HSC ANALYSIS - What to expect and common pitfalls

  • The syllabus splits this topic up into 2 distinct topic areas that cover: 1-Mobile phone plans, and 2-Digital download and file storage. 
  • Digital download and file storage questions definitely represent the harder of the two areas, noting that the mean marks in 2017, 2016 and 2015 HSC questions flagged a lack of understanding by a majority of students.
  • A lack of understanding in the mathematics of "bytes" and the conversion to "bits" has cost a majority of students significant marks in the past three HSC exams! An area that should be given careful attention. 
  • Mobile phone plan concepts that can be challenging include call charges in blocks of time "or part thereof" (asked in 2017 and 2016) and calculations of excess data over plan "caps", the latter of which was tested (and well answered) in 2015.

Filed Under: FS Communication Tagged With: worksheet-preamble

2UG Snapshot FS Driving

HISTORICAL CONTRIBUTION

  • Focus Study: Driving incorporates and further applies content from a number of strands within the context of owning and running a motor vehicle.  
  • Any in-depth analysis of past-HSC contribution is of little value due to the recency of the syllabus changes. However, a few points are worthy of note.

PAST HSC ANALYSIS - What to expect and common pitfalls

  • Depreciation has been tested every year in the last decade, except 2016 (and only a 1-mark multiple choice in 2017). Its average allocation during this time has been a substantial 2.0%. This topic area has been under-examined in the last 4 years and warrants a revision focus.
  • Examiners have included BAC calculations in each of the last 4 papers. An examination trend to take note of for revision.
  • Insurance was tested in 2015 and 2016, and shown to be poorly understood. Not examined in 2017.
  • Note that the "stopping distance" question in 2015 within FS Driving had a mean mark of just 34%. This was not retested in 2017 or 2016 and warrants attention in 2018.
  • Finally, "distance, speed and time equations (D = S x T)" have been the basis of challenging multiple choice questions in the past. Don't take the 2017 question in this area (Band 3) as any indication of the understanding needed in this area. 

Filed Under: Costs to Purchase / Insurance, Depreciation / Running costs, Safety: D=ST & BAC Tagged With: worksheet-preamble

2UG Snapshot FM5 – Annuities and Loan Repayments

HISTORICAL CONTRIBUTION

  • FM4,5 represent the HSC Course within the Financial Maths strand and has accounted for 9.0% of the HSC exam, on average, over the past 10 years.
  • This snapshot will focus on FM5 Annuities and Loan Repayments, which has been worth 4.4% of this allocation.

PAST HSC ANALYSIS - What to expect and common pitfalls

  • FM5 Annuities and Loan Repayments has undergone significant syllabus changes in the last few years. Indeed, almost half of its past HSC allocated marks over the past 10 years are now not examinable! Most notably, the annuities formula is no longer in the syllabus.
  • SmarterMaths removes all questions no longer examinable within the syllabus.
  • Calculating the monthly repayment of a home loan from a table is the most tested "still examinable" question type. Worth noting that this area was examined regularly up until 2010, but not since. 
  • The Future Value of an Annuity Table has been the second most regularly asked question type that remains in the FM5 syllabus, examined in both 2017 and 2016. Both questions proved very challenging and warrant a revision focus.
  • Present Value of an Annuity Table was last tested in 2015, while the Table of Present Value Interest Factors also warrants a review.

Filed Under: FM5 - Annuities and Loan repayments Tagged With: worksheet-preamble

2UG Snapshot FM4 – Credit and Borrowing

HISTORICAL CONTRIBUTION

  • FM4,5 represent the HSC Course within the Financial Maths strand and has accounted for 9.0% of the HSC exam, on average, over the past 10 years.
  • This snapshot will focus on FM4 Credit and Borrowing, which has been worth 4.6% of this allocation.

PAST HSC ANALYSIS - What to expect and common pitfalls

  • FM4 Credit and Borrowing tested "flat rate interest" in 2017 with a 3 mark allocation. Examined in consecutive years in 2011 and 2012, so understand this concept.
  • Credit card questions have been asked in 5 out of the last 8 years, with sub-50% mean marks resulting on each occasion (2015 and 2016 both had mean marks below 40%). Calculating daily interest rates and applying the correct number of days has proven very challenging for the majority of students. This sub-topic area deserves a significant revision focus.
  • The "future value" formula  `FV=PV(1+r)^n`  was tested in 2014 and 2015 but not examined in 2017 or 2016. This topic area allows examiners to test challenging formula calculations and has become more important since the recent syllabus changes that made the annuities formula no longer examinable. A key revision focus area.
  • "Home Loan P+I-R Table" style questions were asked in 2017 and 2016, receiving significant mark allocations each time. This important concept caused significant problems on both occasioins and deserves attention.

Filed Under: FM4 - Credit and Borrowing Tagged With: worksheet-preamble

2UG Snapshot FM3 – Taxation

HISTORICAL CONTRIBUTION

  • FM1,2,3 Financial Maths are very significant contributing Preliminary Course topics to the HSC exam, accounting for an impressive 7.5%, on average, over the past 10 years.
  • This snapshot will focus on FM3 Taxation, which has accounted for 1.9% of each paper. Note this topic area has been given above average allocations in 2017 (3) and 2016 (5).

PAST HSC ANALYSIS - What to expect and common pitfalls

  • FM3 Taxation is a small topic area with highly predicable questions that come from 3 main areas, 1-Tax tables, 2-GST and 3-Medicare.
  • Tax Table problems are the most  common question type in this area, asked in both 2017 and 2016. Longer answer questions can often include other tax elements like medicare (such as 2017 and 2016).
  • GST questions have been asked via multiple choice around once every 3 years. This topic has not been examined since 2015 and deserves revision attention. 
  • Medicare taxation has been tested in both 2017 and 2016, and answered relatively well. Note however that this area caused problems in 2013. Students need to be clear that it is calculated from"taxable income" and not "gross income".

Filed Under: FM3 - Taxation Tagged With: worksheet-preamble

2UG Snapshot FM2 – Investing Money

HISTORICAL CONTRIBUTION

  • FM1,2,3 Financial Maths are very significant Preliminary Course topics, contributing an impressive 7.5% to the HSC exam, on average, over the past 10 years.
  • This snapshot will focus on FM2 Investing Money, which has accounted for 1.9% of each paper. Worth noting that the 2017 exam had an above average topic allocation of 4 marks.

PAST HSC ANALYSIS - What to expect and common pitfalls

  • FM2 Investing has caused problems in the past with questions involving "Compounded Value of $1"  tables. Although well answered in a similar 2016 question, sub-50% mean marks were recorded the previous 3 times this was tested from 2011-13. Revision focus recommended.
  • Dividend Yield was finally re-tested in 2017 (to much improved results) after a poor understanding of the area was flagged in 2013 by Q28d. Ensure you understand this concept.

Filed Under: FM2 - Investing Tagged With: worksheet-preamble

2UG Snapshot FM1 – Earning Money

HISTORICAL CONTRIBUTION

  • FM1,2,3 Financial Maths are very significant contributing Preliminary Course topics to the HSC exam, accounting for an impressive 7.5%, on average, over the past 10 years.
  • This snapshot will focus on FM1 Earning and Managing Money, which has accounted for an average of 3.7% of each paper.

PAST HSC ANALYSIS - What to expect and common pitfalls

  • Earning and Managing Money's contribution to the exam has been a case of feast or famine, with the 2017 allocation of 1 mark firmly in the famine category. In the last decade, allocated marks have ranged from just 1 (in 2013/14/15/17) to 7 (in 2010).
  • Although this topic area has been very well answered in the past and provides a great opportunity for scoring highly, note that it produced sub-50% mean marks in 2009, 2011 and 2013.
  • A recurring theme in Markers Comments for minimising errors has been to set out answers in small clear steps. Take this advice and break down your calculations into bite size pieces!

Filed Under: FM1 - Earning money Tagged With: worksheet-preamble

2UG Snapshot AM5 – Parent

HISTORICAL CONTRIBUTION

  • AM5 Modelling Non-Linear Relationships has contributed a hefty 5.2%, on average, to the HSC exam over the past decade.
  • We have split this area in three main question types which are: 1-Exponential/Quadratic, 2-Inverse Relationships and 3-Area Problems.

PAST HSC ANALYSIS - What to expect and common pitfalls

  • AM5 Exponential/Quadratic questions are easily the most regularly tested question type in this topic area, with an average allocation of 3.0%.
  • Easier marks are often available in questions that require students to recognise non-linear graphs. Know your basic graphs well and collect this low hanging fruit.
  • A common exam problem, asked in 4 out of 5 years on average, requires students to create an equation between one quantity that varies with another. This topic area has proven very challenging in the past and deserves attention.
  • Inverse Relationship questions are almost always poorly answered, and with terrible results in 2014 (Q29a) and not tested since, a revision focus is warranted. Note that giving "limitations" to an inverse relationship recorded a mean mark of just 7% in 2014!
  • Area Problems (0.8%) are given their own category because when asked, they often contain some AM5 content within high-mark, cross-topic questions that are historically poorly answered.

Filed Under: Exponential/Quadratic (Projectile), Inverse, Perimeter/Area problem Tagged With: worksheet-preamble

2UG Snapshot AM5 – Area problems

HISTORICAL CONTRIBUTION

  • AM5 Modelling Non-Linear Relationships has contributed a hefty 5.2%, on average, over the past decade.
  • We have split this area in three main question types which are: 1-Exponential/Quadratic, 2-Inverse Relationships and 3-Area Problems.
  • This topic snapshot will focus on the Area Problems.

PAST HSC ANALYSIS - What to expect and common pitfalls

  • Area Problems (0.8%) have only made up a small percentage of total HSC marks within AM5, but are nonetheless quite important in our view, because they are often asked within large cross-topic questions that have been poorly answered and worth up to 8 marks in the past.

Filed Under: Perimeter/Area problem Tagged With: worksheet-preamble

2UG Snapshot AM5 – Inverse

HISTORICAL CONTRIBUTION

  • AM5 Modelling Non-Linear Relationships has contributed a hefty 5.2%, on average, to the HSC exam over the past 10 years.
  • We have split this area into three main question types which are: 1-Exponential/Quadratic, 2-Inverse Relationships and 3-Area Problems.
  • This topic snapshot will focus on Inverse Relationship questions.

PAST HSC ANALYSIS - What to expect and common pitfalls

  • AM5 Inverse Relationship questions have accounted for 1.5% of the General 2 paper since 2003.
  • Easier marks are often available in multiple choice questions that require students to recognise non-linear graphs, including  graphs of simple inverse relationships.
  • This topic area hasn't been tested in the last 3 HSC exams. We recommend a revision focus as it is almost always poorly answered, particularly when it was last examined in 2014 (Q29a).
  • Pitfalls: Explaining the practical "limitations" of an inverse relationship within a context recorded a mean mark of just 7% in 2014, the last time it was tested!

Filed Under: Inverse Tagged With: worksheet-preamble

2UG Snapshot AM5 – Exponential/Quadratic

HISTORICAL CONTRIBUTION

  • AM5 Modelling Non-Linear Relationships has contributed a hefty 5.2%, on average, to the HSC exam over the past 10 years.
  • We have split this area in three main question types which are: 1-Exponential/Quadratic, 2-Inverse Relationships and 3-Area Problems.
  • This topic snapshot will focus on the Exponential/Quadratic question type.

PAST HSC ANALYSIS - What to expect and common pitfalls

  • AM5 Exponential/Quadratic was very well represented in the 2017 exam (6 marks), and is easily the most regularly tested question type in this topic area, with an average allocation of 3.0%.
  • Easier marks are often available in multiple choice questions that require students to recognise non-linear graphs. Examined in over 50% of exams (notably not in 2017 or 2016), with exponential and quadratics graphs often featuring.
  • Longer answer style questions that provide students with an equation where quantities vary with an exponential power of another quantity are common. Examined and poorly answered in 2017 and 2016, this is an important revision area.

Filed Under: Exponential/Quadratic (Projectile) Tagged With: worksheet-preamble

2UG Snapshot AM4 – Parent

HISTORICAL CONTRIBUTION

  • AM4 Modelling Linear Relationships has a significant overlap with the Focus Study: Mathematics and Health and is worth an expected 7.2% of the HSC exam.
  • We have split this area in three main question types which are: 1-Breakeven and Financial Analysis, 2-Other Linear Modelling and 3-Cross-Topic Ovelaps.

PAST HSC ANALYSIS - What to expect and common pitfalls

  • AM4 Financial Analysis questions have asked students to derive or interpret linear equations that involve profits, costs and tax payable. A focus revision area as it was not examined in 2016 or 2017 after being poorly answered in 2015 in a 4 mark question.
  • AM4 Breakeven Analysis - omitted in 2017 and examined at a low band level in 2016. Worthy of a revision focus as it was poorly answered the three previous times, in 2015, 2011 and 2010. 
  • AM4 Other Linear Modelling (1.1%). Be aware that examiners consistently require students to interpret the gradient of derived linear equations, and describe their limitations. These areas are almost always poorly answered!
  • Cross Topic Overlaps (3.4%). Recent trends show a significant amount of AM4 content is tested under the FS Health banner and revising with this in mind is recommended.

Filed Under: Breakeven and Financial modelling, Other Linear Modelling Tagged With: worksheet-preamble

2UG Snapshot AM4 – Other Linear Modelling

HISTORICAL CONTRIBUTION

  • AM4 Modelling Linear Relationships is a topic area regularly examined in cross-topic questions, notably with the Focus Study: Mathematics and Health. If we include these overlaps, this topic area represents an expected 7.2% of the exam.
  • We have split this area in three main question types which are: 1-Breakeven and Financial Analysis, 2-Other Linear Modelling and 3-Cross Topic Overlaps.
  • This topic snapshot will focus on the last two question types.

PAST HSC ANALYSIS - What to expect and common pitfalls

  • AM4 Other Linear Modelling (1.1%) questions regularly ask students to work with linear equations in an applied context. Examiners consistently require students to interpret the gradient of such graphs and describe its limitations. This question type is almost always poorly answered, including a 4-mark question in 2017!
  • Cross-Topic Overlaps (3.4%) is where AM4's content and concepts are applied and developed further. Recent trends show a significant amount of AM4 content is tested under the FS Health banner and revising with this in mind is recommended.
  • Line of Best Fit questions within the FS Health sub-topics of Body Measurements and Life Expectancy represent an important trend in the examination of AM4 Linear Modelling, attracting significant mark allocations in 2013, 2014, 2015 and 2017.

Filed Under: Other Linear Modelling Tagged With: worksheet-preamble

2UG Snapshot AM4 – Breakeven analysis

HISTORICAL CONTRIBUTION

  • AM4 Modelling Linear Relationships is a topic area regularly examined in cross-topic questions, notably with the Focus Study: Mathematics and Health. If we include these overlaps, this topic area represents an expected 7.2% of the exam.
  • We have split this topic into three main question types for revision purposes which are: 1-Breakeven and Financial Analysis, 2-Other Linear Modelling and 3-Cross-Topic Overlaps.
  • This topic snapshot will focus on AM4 Breakeven and Financial Analysis which historically gets the highest mark allocation in this group.

PAST HSC ANALYSIS - What to expect and common pitfalls

  • AM4 Breakeven Analysis was left off the 2017 exam for the first time in 3 years. Although the area only attracted a Band 3 level question when last tested in 2016, be aware that all other times resulted in a sub-50% mean marks, highlighting this as a very challenging area for most students.
  • AM4 Financial Analysis questions have asked students to derive or interpret linear equations that involve profits, costs and tax payable. This question type is a recommended focus because it wasn't examined in 2017 or 2016 after being poorly answered in 2015 in a significant 4 mark question.

Filed Under: Breakeven and Financial modelling Tagged With: worksheet-preamble

2UG Snapshot AM2 – Linear (Prelim)

HISTORICAL CONTRIBUTION

  • AM2/4 Linear Relationships (5.0%) is a topic area with significant cross-topic overlaps, notably with Focus Study: Mathematics and Health. If we include the increasingly examined focus study overlaps, this topic area represents an expected 8.4% of the exam.
  • This analysis will focus on AM2 Linear Relationships (Prelim) which has a modest historical contribution of 1.2%.

PAST HSC ANALYSIS - What to expect and common pitfalls

  • AM2 has overwhelmingly been tested via multiple choice with the most common question types asking students to identify the graphs of simple linear equations or find gradients from simple graphs.
  • This area is generally well answered although sub-50% mean marks occurred in 2014 and 2012, so cover these questions and eradicate silly errors!
  • Currency Conversion is specifically mentioned in the syllabus and hasn't been asked since 2012. It was allocated a chunky 4 marks in 2007, and is worthy of attention.

Filed Under: AM2 - Linear Relationships (Prelim) Tagged With: worksheet-preamble

2UG Snapshot DS5,6 – Normal Distribution and Sampling

HISTORICAL CONTRIBUTION

  • DS5,6 The Normal Distribution and Population Sampling is an important area of the General 2 course worth 4.4% of the HSC exam, on average, over the last 10 years.

PAST HSC ANALYSIS - What to expect and common pitfalls

  • Normal Distribution (3.4%) questions have been asked every year in the last decade, often with chunky 4-5 mark allocations. With sub-50% mean marks very common (including much lower in 2017!), this is a key area to outperform. A revision focus here is highly recommended.
  • Marker's Comments of note: Graphically representing `z`-scores on a curve to calculate percentages has been specifically mentioned as a feature of the "more successful" responses in past HSC exams. Heed this advice and minimise errors!
  • Population Sampling DS6 (1.0%) is almost exclusively examined through Capture/Recapture questions. This area has been tested in each of the last 3 exams (and poorly answered in 2016 and 2015).

Filed Under: DS5/6 - Normal Distribution and Sampling Tagged With: worksheet-preamble

2UG Snapshot DS2,3,4 – Summary Stats

HISTORICAL CONTRIBUTION

  • DS2,3,4 Displaying and Interpreting Data Sets and Summary Statistics is one of the most important areas of the General 2 course, contributing 11.5% on average each year.
  • This analysis will focus on Summary Statistics, which have contributed an average of 3.0% to each HSC exam over the past 10 years.

PAST HSC ANALYSIS - What to expect and common pitfalls

  • Summary Statistics questions require students to calculate data statistics such as median, mean and standard deviation (by calculator) given a simple data set. 
  • Pitfalls: Although generally well-answered, the difficulty level has increased in the last 4 years, with questions producing sub-50% mean marks in each of these years.
  • Note that the 2017 (Q30a) and 2015 (Q27d) exams exposed a lack of understanding in what constitutes an "outlier" and related calculations. This area should be revised thoroughly.
  • Marker Comments have highlighted past issues for many students in finding the mean of grouped data, where they must use the "class centres" for their calculations. This caused major issues in both 2014 and 2006 and deserves attention.

Filed Under: Summary Statistics (no graph) Tagged With: worksheet-preamble

2UG Snapshot DS2,3,4 – Other Graphs

HISTORICAL CONTRIBUTION

  • DS2,3,4 Displaying and Interpreting Data Sets and Summary Statistics is one of the most important areas of the General 2 course, contributing 11.5% on average each year.
  • This analysis will focus on Other Graphs, which contributed 1.6% in the past, and includes any graphs that are not Histograms, Box and Whisker, or Stem and Leaf charts.

PAST HSC ANALYSIS - What to expect and common pitfalls

  • The most common Other Graphs that have appeared in the HSC since 2003 are Radar Charts and Area Graphs. 
  • Less common and "simpler" graphs that have been tested in recent years include Sector Graphs and Step Graphs
  • Radar Chart questions are much easier, typically well answered and were last examined in 2012.
  • Pitfalls: Area Graphs have proven challenging for students in past years although the 2017 question was relatively well answered (note that area graphs were examined in back to back years in the 2010/2011).
  • A lack of understanding of the "cumulative" nature of these graphs has been specifically mentioned in past Markers' Comments and warrants attention.

Filed Under: Other Graphs Tagged With: worksheet-preamble

2UG Snapshot DS2,3,4 – BW and SL

HISTORICAL CONTRIBUTION

  • DS2,3,4 Displaying and Interpreting Data Sets and Summary Statistics is one of the most important areas of the General 2 course, contributing 11.5% on average, over the last decade.
  • This analysis will focus on Box and Whisker and Stem and Leaf plots which have contributed an average of 3.8% each year.

PAST HSC ANALYSIS - What to expect and common pitfalls

  • Box and Whisker plots were examined in a solitary multiple choice question in both 2015, 2016 and 2017. In 2010, 2012, and 2014, this topic area was allocated between 4-6 marks in questions where students needed to compare two B&W plots. This question type is overdue to be tested in a significant way.
  • Stem and Leaf  plots were last examined in a longer answer question in 2016 after 2 years of not appearing. Note that they were examined every year between 2007-2013 and remain a critical revision area.
  • Double Stem and Leaf plots produced sub-50% mean marks the last 4 times they were examined (including 2016), so revision in this specific area is well advised.
  • Although Box and Whisker and Stem and Leaf mark allocations often cannibalise each other in any one given year, they have been under-examined in recent times versus historical allocations (particularly in 2017) and are an important revision focus.

Filed Under: Stem & Leaf, Box & Whisker Tagged With: worksheet-preamble

2UG Snapshot DS2,3,4 – Histogram

HISTORICAL CONTRIBUTION

  • DS2,3,4 Displaying and Interpreting, Data Sets and Summary Statistics is one of the most important topic areas of the General 2 course, accounting for a substantial 11.5% each year.
  • This analysis will focus on Bar Charts and Histograms which have contributed an average of 2.9% per paper.

PAST HSC ANALYSIS - What to expect and common pitfalls

  • Bar Chart & Histogram (2.9%) questions can go from simple bar charts to the significantly harder cumulative frequency histograms.
  • The more difficult cumulative frequency histogram questions are examined the most often, asked in 4 out of the last 5 years but significantly not in 2017. A highly recommended revision focus area.
  • Pitfalls: Markers have consistently highlighted student difficulties in working with "class centres" and a very poor understanding of finding the median and quartile values of cumulative frequency histograms. With mean marks below 50% (and some well below 50%) each of the last 4 times it has been examined, students can meaningfully outperform their peers in this area.

Filed Under: Bar Charts and Histograms Tagged With: worksheet-preamble

2UG Snapshot MM6 – Circle Geometry

HISTORICAL CONTRIBUTION

  • MM6 Circle Geometry is a sneaky big contributor to the General 2 exam, responsible for an average of 4.5% of the exam over the past 10 years.
  • The vast majority of this is allocated to "Great Circle Applications" involving latitude and longitude problems, while a small percentage tests students on simple arc length calculations.

PAST HSC ANALYSIS - What to expect and common pitfalls

  • MM6 Circle Geometry is examined every year and has been allocated two questions each year since 2010. This topic has caused difficulties in 5 of the last 6 years, producing sub-50% mean marks. A solid conceptual knowledge has proven necessary to score highly here.
  • Student competence in calculating the time differences and distances between two places given their longitude and latitude coordinates, cannot be emphasised enough, as it will be tested.
  • Markers' Comments of note: Calculating the time difference between places from an angular difference is a proven problem area from past exams. It stumped 50% of students in 2017, 2014 and 2013, and simply requires the application of  15° = 1 hour, or 1° = 4 minutes  difference.
  • A good yardstick on understanding in this topic is Q27b 2011 where examiners dialled up the difficulty level.

Filed Under: MM6 - Spherical Geometry Tagged With: worksheet-preamble

2UG Snapshot MM4 – Area and Volume

HISTORICAL CONTRIBUTION

  • Perimeter, Area and Volume is examined through the preliminary topic MM2 (1.6%), and MM4 (6.9%), making an average contribution to the HSC of 8.5%.
  • MM4 (6.9%) has been divided up into 3 main question types for the purposes of this analysis which are: 1-Perimeter, Area and Volume (4.1%) questions, 2-Simpson's Rule (2.1%), and 3-% Error (0.7%).

PAST HSC ANALYSIS - What to expect and common pitfalls

  • MM4 Perimeter, Area and Volume questions have made up a very healthy 4.1% of the exam. This area is consistently examined in a meaningful way, and is a key focus area for any revision.
  • The degree of difficulty of past questions has varied greatly. Note the 2017 HSC exam provided an example of the highest level of difficulty that might be asked in this sub-topic.
  • Due to significant changes in this part of the syllabus in recent years, SmarterMaths has omitted or adjusted any questions no longer relevant so you know you're only studying what is examinable in 2018.
  • Simpson's Rule (2.1%) was most recently examined in 2017 and 2014. Note 2017's question produced an 11% mean mark in one of the "associated" question parts (involving the conversion of km² to m²).
  • % Error (0.7%) questions have been a minor contributor to the General 2 paper over the last decade, but there has been a notable uptick in recent years, with the topic being examined in 2017, 2015, 2014 and 2013. This area has proven very challenging in the past and is well worth specific revision coverage.

Filed Under: Areas and Volumes (Harder), Simpson's Rule/Measurement Error Tagged With: worksheet-preamble

2UG Snapshot PB2 – Parent

HISTORICAL CONTRIBUTION

  • Probability is made up of PB1 (3.5%) and PB2 (9.0%) and has contributed an average of 12.5% to the HSC exam over the past 10 years.
  • PB2 (9.0%) has been divided up into 3 main question types in this analysis and they are 1-Combinations, 2-Financial Expectations and 3-Multi-Stage Probability.

PAST HSC ANALYSIS - What to expect and common pitfalls

  • Multi-Stage Events (4.6%) is easily the most examined topic area within PB2.
  • Within this area, probability trees have been examined in 5 of the last 6 years, but not in 2017. A must know critical focus area, answered poorly in 2015 and 2016.
  • Combinations questions (2.0%) are examined every year, often involving questions on number plates, PINs, ice-cream flavours, committee combinations etc...
  • Combinations are historically poorly answered and deserve attention (such as in 2017). Note that the concept of ordered versus unordered selections consistently causes major problems.
  • Financial Expectation (2.4%) questions have been examined in 5 of the the last 8 years. Not tested in 2017 and with sub-50% mean marks the last 5 times it has been tested, it represents a key revision focus area.

Filed Under: # Combinations, Financial Expectation, Multi-stage Events Tagged With: worksheet-preamble

2UG Snapshot PB2 – MSE

HISTORICAL CONTRIBUTION

  • Probability is made up of PB1 (3.5%) and PB2 (9.0%) and has contributed an average of 12.5% to the HSC exam over the past 10 years.
  • PB2 (9.0%) has been divided up into 3 main question types in this analysis and they are 1-Combinations, 2-Financial Expectations and 3-Multi-Stage Probability.
  • This snapshot will focus on Multi-Stage Events.

PAST HSC ANALYSIS - What to expect and common pitfalls

  • Multi-Stage Events (4.6%) is easily the most examined topic area within PB2.
  • Expect two questions in this historically poorly answered topic area. An important area where students targetting higher bands need to perform.
  • Within this topic, probability trees have been examined in 5 of the last 6 years, but notably not included in the 2017 paper. A must know critical focus area, answered poorly in 2016 and 2015, that has contributed an average of 2.5% per paper.
  • Front of mind when looking at probability questions - examiners regularly pose problems that can be solved using the important identity  "P(E) = 1 - P(Event NOT happening)".

Filed Under: Multi-stage Events Tagged With: worksheet-preamble

2UG Snapshot PB2 – Financial Expectation

HISTORICAL CONTRIBUTION

  • Probability is made up of PB1 (3.5%) and PB2 (9.0%) and has contributed an average of 12.5% to the HSC exam over the past 10 years.
  • PB2 (9.0%) has been divided up into 3 main question types in this analysis and they are 1-Combinations, 2-Financial Expectations and 3-Multi-Stage Probability. This analysis looks at Financial Expectation questions.

PAST HSC ANALYSIS - What to expect and common pitfalls

  • Financial Expectation (2.4%) questions have been examined in 5 of the last 8 years. Worth noting it was not examined in the 2017 exam.
  • This topic represents a critical area of competence for scoring well, particularly given examiners have only tested this area in longer answer (i.e. multi-mark) questions since 2004.
  • The last 5 times this topic has been examined, mean marks have been sub-50% on each occasion.
  • The predictable nature of the questions in this topic area and the common errors make past poor results surprising! It presents a real opportunity for students willing to do the legwork through worked examples.

Filed Under: Financial Expectation Tagged With: worksheet-preamble

2UG Snapshot PB2 – Combinations

HISTORICAL CONTRIBUTION

  • Probability is made up of PB1 (3.5%) and PB2 (9.0%) and has contributed an average of 12.5% to the HSC exam over the past 10 years.
  • PB2 (9.0%) has been divided up into 3 main question types in this analysis which are: 1-Combinations, 2-Financial Expectations and 3-Multi-Stage Probability. This analysis looks at Combinations.

PAST HSC ANALYSIS - What to expect and common pitfalls

  • Combinations questions (2.0%) are examined at least once every year, often involving questions on number plates, PINs, ice-cream flavours, committee combinations etc...
  • This topic area is typically poorly answered, with sub-50% mean marks common.
  • The concept of ordered versus unordered selections consistently causes major problems, as it did in the 2017 exam, and deserves particular attention.
  • With mean marks below 50% in 6 of the last 9 HSC exams, this question type is a very good focus area for those students targeting higher band results.

Filed Under: # Combinations Tagged With: worksheet-preamble

2UG Snapshot PB1 – Probability

HISTORICAL CONTRIBUTION

  • Probability is made up of the Preliminary Course PB1 (3.5%), and the HSC Course PB2 (9.0%). Together, they have contributed an average of 12.5% to the HSC exam.
  • PB1 (3.5%) has been split into 3 main question types for the purposes of this analysis, which are 1-Relative Frequency, 2-Fundamental Understanding, and 3-Single Stage events.

PAST HSC ANALYSIS - What to expect and common pitfalls

  • Relative Frequency (2.5%) is easily the most common question type examined in the HSC within PB1. It is tested every year and although it typically provides low lying fruit for high scoring, note the sub-50% mean marks in 2017 (Q29c) and in 2016 (Q23) that were surprisingly poorly answered and deserve attention. 
  • Fundamental Understanding (0.5%) is a minor contributor to the exam. Although usually very well answered, ensure you pay attention to Q26c 2013 that shows one of the few pitfalls.
  • Single Stage events (0.5%) are a simpler version of what might be tested in PB2 . Note that all questions that ask students to calculate "combinations" are included under PB2 to provide a more effective revision grouping.

Filed Under: Fundamental understanding, Relative Frequency, Single stage events Tagged With: worksheet-preamble

2UG Snapshot MM3 – Parent

HISTORICAL CONTRIBUTION

  • Trigonometry is examined through the Preliminary Course MM3 (2.9%) and the HSC Course MM5 (6.7%), contributing an average of 9.6% to the HSC exam.
  • This analysis looks at MM3 and has been divided into 2 main question groups which are: 1-Pythagoras and Basic Trig (1.2%), and 2-Similarity and Scale (1.7%).

PAST HSC ANALYSIS - What to expect and common pitfalls

  • MM3 Pythagoras and Basic Trig is most commonly tested via multiple choice questions although longer answer style (i.e. multi-mark) questions have sporadically appeared, such as in 2017 and 2014.  
  • This preliminary topic is a great area to pick up marks, but note that questions in 2012 (Q4) and 2009 (Q23a) produced sub-50% mean marks and deserve attention.
  • Note that rounding an angle to the nearest minute was required in 2017 (a surprise to many observers) and should be covered.
  • MM3 Similarity was omitted from the HSC exam in 2017 - the first time it hasn't been tested in 6 years. A consistently examined area of the syllabus and highly recommended revision focus.
  • MM3 Scale was tested in 3 consecutive years between 2010-2012 in questions worth 2-3 marks. Since then, only 2015 Q29c has touched on this area and it was badly answered. A dedicated question on this under-examined topic area is overdue.

Filed Under: Pythagoras and basic trigonometry, Similarity and Scale Tagged With: worksheet-preamble

2UG Snapshot MM3 – Similarity

HISTORICAL CONTRIBUTION

  • Trigonometry is examined through the Preliminary Course MM3 (2.9%) and the HSC Course MM5 (6.7%), contributing an average of 9.6% to the HSC exam.
  • This analysis looks at MM3 and has been divided into 2 main question groups which are: 1-Pythagoras and Basic Trig (1.2%), and 2-Similarity and Scale (1.7%).

PAST HSC ANALYSIS - What to expect and common pitfalls

  • MM3 Pythagoras and Basic Trig is most commonly tested via multiple choice questions although longer answer style (i.e. multi-mark) questions have sporadically appeared, such as in 2017 and 2014.  
  • This preliminary topic is a great area to pick up marks, but note that questions in 2012 (Q4) and 2009 (Q23a) produced sub-50% mean marks and deserve attention.
  • Note that rounding an angle to the nearest minute was required in 2017 (a surprise to many observers) and should be covered.
  • MM3 Similarity was omitted from the HSC exam in 2017 - the first time it hasn't been tested in 6 years. A consistently examined area of the syllabus and highly recommended revision focus.
  • MM3 Scale was tested in 3 consecutive years between 2010-2012 in questions worth 2-3 marks. Since then, only 2015 Q29c has touched on this area and it was badly answered. A dedicated question on this under-examined topic area is overdue.

Filed Under: Similarity and Scale Tagged With: worksheet-preamble

2UG Snapshot MM3 – Pythagoras and Basic Trig

HISTORICAL CONTRIBUTION

  • Trigonometry is examined through the Preliminary Course MM3 (2.9%) and the HSC Course MM5 (6.7%), contributing an average of 9.6% to the HSC exam.
  • This analysis looks at MM3 and has been divided into 2 main question groups which are: 1-Pythagoras and Basic Trig (1.2%), and 2-Similarity and Scale (1.7%).

PAST HSC ANALYSIS - What to expect and common pitfalls

  • MM3 Pythagoras and Basic Trig is most commonly tested via multiple choice questions although longer answer style (i.e. multi-mark) questions have sporadically appeared, such as in 2017 and 2014.  
  • This preliminary topic is a great area to pick up marks, but note that questions in 2012 (Q4) and 2009 (Q23a) produced sub-50% mean marks and deserve attention.
  • Note that rounding an angle to the nearest minute was required in 2017 (a surprise to many observers) and should be covered.
  • MM3 Similarity was omitted from the HSC exam in 2017 - the first time it hasn't been tested in 6 years. A consistently examined area of the syllabus and highly recommended revision focus.
  • MM3 Scale was tested in 3 consecutive years between 2010-2012 in questions worth 2-3 marks. Since then, only 2015 Q29c has touched on this area and it was badly answered. A dedicated question on this under-examined topic area is overdue.

Filed Under: Pythagoras and basic trigonometry Tagged With: worksheet-preamble

2UG Snapshot MM5 – Parent

HISTORICAL CONTRIBUTION

  • The Measurement strand has contributed 24.6% of the General 2 course over the past 10 years. Trigonometry is examined through MM3 (2.9%) and MM5 (6.7%), and makes up a sizeable 9.6% of this strand.
  • MM5 has been divided into 3 main question-types. Bearings (3.1%) is easily the most examined, with 2-Triangle and Harder Trig Problems (2.1%) and Non-Right Angled Trig (1.5%) also making good contributions.

PAST HSC ANALYSIS - What to expect and common pitfalls

  • MM5 Bearings is consistently examined with a meaningful historical mark allocation of 3.1%. A critical area of competence and revision focus.
  • Bearings is the most challenging question-type within MM5 and represents an important area for higher band students to outperform.
  • Harder Trig and 2-Triangle questions have proven challenging with a majority of questions in the last decade resulting in sub-50% state mean marks.
  • 2-Triangle questions have been examined 5 times since 2009, but not in 2017 or 2016. A revision area that warrants attention.
  • Non-Right Angled Trig (1.5%) is often examined within bearings, but "non-bearings" questions are also important - last examined in 2015 and poorly answered.

Filed Under: 2-Triangle and Harder Examples, Bearings & Field Surveys, Non-Right Angled Trig Tagged With: worksheet-preamble

2UG Snapshot MM5 – 2tri and Harder Examples

HISTORICAL CONTRIBUTION

  • The Measurement strand has contributed 24.6% of the General 2 course over the past 10 years, and MM3 (2.9%) and MM5 (6.7%) are responsible for a sizeable 9.6% of this.
  • MM5 has been divided into 3 main question-types as seen in the graph above, and this analysis will concentrate on the Harder Trig and 2-Triangle question type.

PAST HSC ANALYSIS - What to expect and common pitfalls

  • MM5 Harder Trig and 2-Triangle questions have accounted for an average of 2.1% of the HSC exam over the past 10 years.
  • The topic area has proven very challenging for students, with the majority of mean marks below 50% in the past decade.
  • 2-Triangle questions have been asked 5 times since 2009 (but not in 2017 or 2016) and must be a focus of any revision in this topic.

Filed Under: 2-Triangle and Harder Examples Tagged With: worksheet-preamble

2UG Snapshot MM5 – Non-RAT

HISTORICAL CONTRIBUTION

  • The Measurement strand has contributed 24.6% of the General 2 course over the past 10 years, and MM3 (2.9%) and MM5 (6.7%) are responsible for a sizeable 9.6% of this.
  • MM5 has been divided into 3 main question-types as seen in the graph above, and this analysis will concentrate on the Non-Right Angled Triangle sub-topic.

PAST HSC ANALYSIS - What to expect and common pitfalls

  • MM5 Non-Right Angled Triangle (non-RAT) questions have accounted for an average of 1.5% of the HSC exam over the past 10 years, with a volatile allocation ranging from 1-5 marks.
  • While non-RAT calculations are a core competence within Bearings, this analysis is restricted to non-Bearings HSC questions.
  • This topic had a meaningful mark allocation in 2015 (and was poorly answered), and has not appeared in the last two years.
  • Although generally well answered, it is worth noting that Q26d 2010 proved extremely challenging and resulted in a surprisingly low mean mark of 32%.
  • This topic area has typically been examined in a simple "apply the formula" type fashion, but it is worth noting that some longer, more involved questions can be asked, as seen in 2015, 2008 and 2006.

Filed Under: Non-Right Angled Trig Tagged With: worksheet-preamble

2UG Snapshot MM5 – Bearings

HISTORICAL CONTRIBUTION

  • The Measurement strand has contributed a massive 24.6% of the General 2 course over the past 10 years, and MM3 (2.9%) and MM5 (6.7%) are responsible for a sizeable 9.6% of this.
  • MM5 has been divided into 3 main question-types (see graph above) and this analysis will be focusing on Bearings questions, which have been worth 3.1% of the exam.

PAST HSC ANALYSIS - What to expect and common pitfalls

  • MM5 Bearings received a healthy mark allocation in both 2017 and 2016, slightly above its historical average. This topic is consistently examined with a meaningful mark allotment, and is a critical area of revision.
  • Bearings questions have easily been the most poorly answered question type within MM5, and 8 out of the last 9 years have seen sub-50% state mean marks!
  • Recent trends have seen Radial Surveys examined in 3 out of the last 5 years, while Field Diagrams were examined for the first time in 2016 since 2008.
  • HSC Markers' Comments of note: Successful students in this area draw North/South parallel lines through important points on a large clear diagrams. Simple advice. Follow it.

Filed Under: Bearings & Field Surveys Tagged With: worksheet-preamble

2UG Snapshot AM1/3 – Algebra

HISTORICAL CONTRIBUTION

  • The Algebra and Modelling strand has contributed 16.3% of the General 2 course over the last 10 years, and AM1 Algebraic Manipulation (1.7%) and AM3 Algebraic Techniques (4.3%) are responsible for 6.0% of this, as shown in the graph.

PAST HSC ANALYSIS - What to expect and common pitfalls

  • AM1 and AM3 are high scoring topic areas, but keep in mind that in 4 out of the last 5 years, at least one question in this "easy" area has had a sub-50% State mean mark (and some substantially below). Be vigilant!
  • Pitfalls: Simultaneous equations have been poorly answered in recent times (including 2016 and 2017) and deserve particular attention.
  • Rearranging formulas has been examined in 8 of the last 9 years in questions worth 1-2 marks. Note Q28d in 2017 and Q21 MC in 2013 caused serious problems and should be included in any revision.
  • Using index laws to simplify equations is an examiner favourite, notably absent in 2017, but asked the previous 7 years. Review carefully as this seemingly easy area had sub-50% mean marks in 2010, 2012 and 2015!
  • Students need exposure to "Find the Mistake" style questions that have been surprisingly badly answered in the past. 

Filed Under: AM1 - Algebra (Prelim), Formula Rearrange, Index and Log Laws, Linear and Other Equations Tagged With: worksheet-preamble

nsw-ext1-platinum-t318-b6

nsw-ext1-platinum-t318-b6

Filed Under: Uncategorized Tagged With: graphic-preamble, worksheet-preamble

nsw-ext1-platinum-t318-b5

nsw-ext1-platinum-t318-b5-2

Filed Under: Uncategorized Tagged With: graphic-preamble, worksheet-preamble

nsw-ext1-platinum-t318-b3/4

nsw-ext1-platinum-t318-b3_4-3

Filed Under: Uncategorized Tagged With: graphic-preamble, worksheet-preamble

nsw-ext1-platinum-other-b6

nsw-ext1-platinum-other-b6

Filed Under: Uncategorized Tagged With: graphic-preamble, worksheet-preamble

nsw-ext1-platinum-other-b5

nsw-ext1-platinum-other-b5

Filed Under: Uncategorized Tagged With: graphic-preamble, worksheet-preamble

nsw-ext1-platinum-other-b3/4

nsw-ext1-platinum-other-b3_4

Filed Under: Uncategorized Tagged With: graphic-preamble, worksheet-preamble

nsw-ext1-platinum-t17-b6

nsw-ext1-platinum-t17-b6

Filed Under: Uncategorized Tagged With: graphic-preamble, worksheet-preamble

nsw-ext1-platinum-t17-b5

nsw-ext1-platinum-t17-b5

Filed Under: Uncategorized Tagged With: graphic-preamble, worksheet-preamble

nsw-ext1-platinum-t17-b3/4

nsw-ext1-platinum-t17-b3_4

Filed Under: Uncategorized Tagged With: graphic-preamble, worksheet-preamble

nsw-ext1-platinum-t16-b6

nsw-ext1-platinum-t16-b6

Filed Under: Uncategorized Tagged With: graphic-preamble, worksheet-preamble

  • « Previous Page
  • 1
  • …
  • 4
  • 5
  • 6
  • 7
  • 8
  • …
  • 10
  • Next Page »

Copyright © 2014–2025 SmarterEd.com.au · Log in