SmarterEd

Aussie Maths & Science Teachers: Save your time with SmarterEd

  • Login
  • Get Help
  • About

HMS, TIP 2015 HSC 19 MC

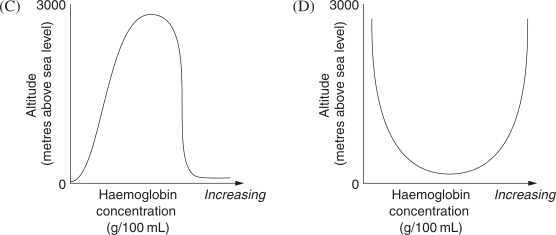
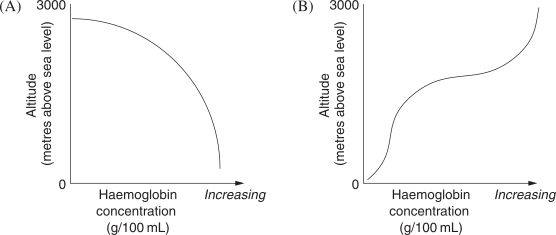
Which of the following graphs is most likely to represent an athlete's haemoglobin concentration while training at different altitudes for up to four weeks?


Show Answers Only

\(B\)

Show Worked Solution
  • B is correct: Haemoglobin increases at higher altitude as physiological adaptation.

Other Options:

  • A is incorrect: Altitude training increases not decreases haemoglobin levels.
  • C is incorrect: Body adapts to altitude by increasing haemoglobin concentration.
  • D is incorrect: Haemoglobin shows consistent increase not random fluctuation.

Filed Under: Physiological adaptations and improved performance Tagged With: Band 4, smc-5461-10-Cardio adaptations

Copyright © 2014–2026 SmarterEd.com.au · Log in