For a certain item, the quantity produced and the quantity sold depend on the selling price of each item.
Let \(Q\) be the quantity produced or sold, and \(P\) be the selling price of each item.
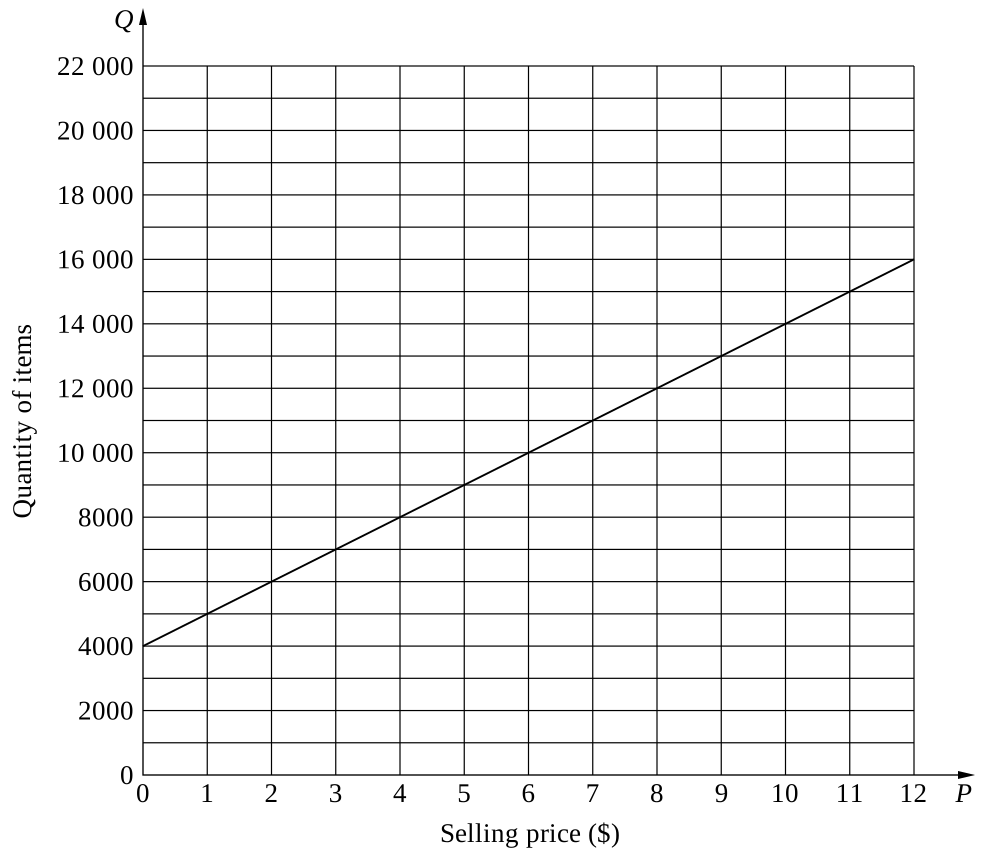
If the selling price of each item is $1, then 5000 items will be produced.
An extra 1000 items will be produced for every $1 increase in the selling price.
The graph of this relationship is shown.
The following information is provided:
- 20 000 items are sold when the selling price of each item is $1
- 2000 items are sold when the selling price of each item is $10.
Use these points to construct the line representing the relationship between the number of items sold and the selling price to find the selling price at the point of intersection. (3 marks)
--- 3 WORK AREA LINES (style=lined) ---
\(\text{Plot the points}\ (1,20\,000)\text{ and }(10,2000): \)
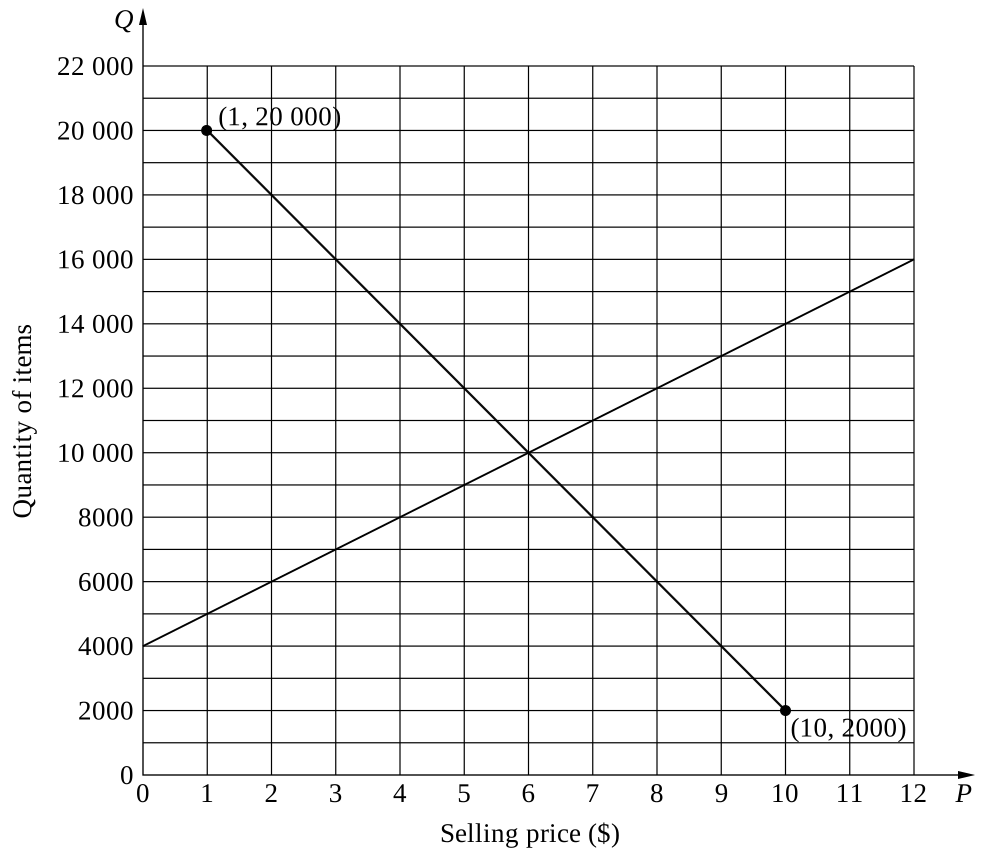
\(\text{The graphs intersect at }P=6.\)
\(\therefore \text{ The selling price is }\$6.\)