This graph shows the amount of electricity generated by solar power and wind power in the Australian states.

Which state generates the most electricity using wind power?
| WA | Tas | SA | Vic | NSW | Qld |
|
|
|
|
|
|
|
Aussie Maths & Science Teachers: Save your time with SmarterEd
This graph shows the amount of electricity generated by solar power and wind power in the Australian states.
Which state generates the most electricity using wind power?
| WA | Tas | SA | Vic | NSW | Qld |
|
|
|
|
|
|
|
This graph shows the number of goals a soccer team scored in a full season.

One match incorrectly recorded the team scoring no goals when they scored one.
What effect does this have on the mean and mode of the data?
|
|
The mean decreases and the mode changes. |
|
|
The mean increases and the mode changes. |
|
|
The mean decreases and the mode does not change. |
|
|
The mean increases and the mode does not change. |
This graph shows a company's profit over a four year period.
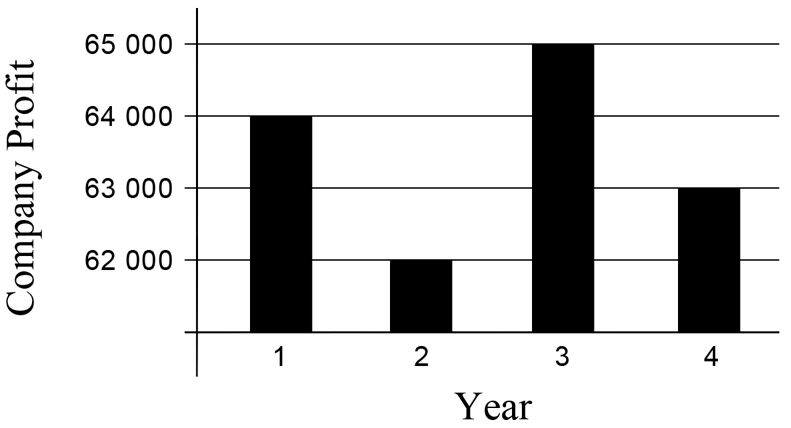
Which conclusion can be reached from the graph?
|
|
The profit in Year 2 was one third of the profit in Year 1. |
|
|
The profit fell by 50% from Year 3 to Year 4. |
|
|
The profits were positive in Years 1 and 3, and negative in Years 2 and 4. |
|
|
The profits were greater than $60 000 in the period between Year 1 and Year 4. |
Luke picked bananas for 30 days. He counted the total number of bananas he picked everyday and created the graph shown below.

How many days did Luke pick less than 145 bananas?
| `7` | `9` | `13` | `17` |
|
|
|
|
|