SmarterEd

Aussie Maths & Science Teachers: Save your time with SmarterEd

  • Login
  • Get Help
  • About

Algebra, NAP-D3-NC10

Jeremy sold ice creams out of his ice cream truck.

He drew the graph below to show how the number of ice creams he sells in a week is related to their price.


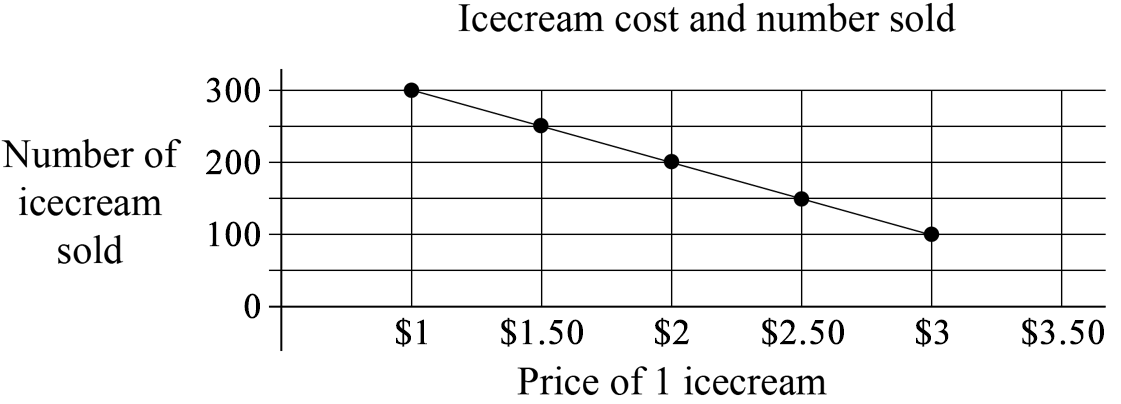
Which statement best describes the graph?

 
As the ice cream price goes up, the number sold goes down.
 
As the ice cream price goes up, the number sold goes up.
 
As the ice cream price goes down, the number sold goes down.
 
As the ice cream price goes down, the number sold stays the same.
Show Answers Only

`text(As the ice cream price goes up, the number)`

`text(sold goes down.)`

Show Worked Solution

`text(As the ice cream price goes up, the number)`

`text(sold goes down.)`

Filed Under: Patterns and Coordinate Geometry (8), Patterns and The Number Plane Tagged With: Band 6, smc-3151-50-Linear graph analysis, smc-664-50-Linear graph analysis

Copyright © 2014–2025 SmarterEd.com.au · Log in