Statistics, NAP-A4-NC31
This graph shows the number of goals a soccer team scored in a full season.
One match incorrectly recorded the team scoring no goals when they scored one.
What effect does this have on the mean and mode of the data?
|
|
The mean decreases and the mode changes. |
|
|
The mean increases and the mode changes. |
|
|
The mean decreases and the mode does not change. |
|
|
The mean increases and the mode does not change. |
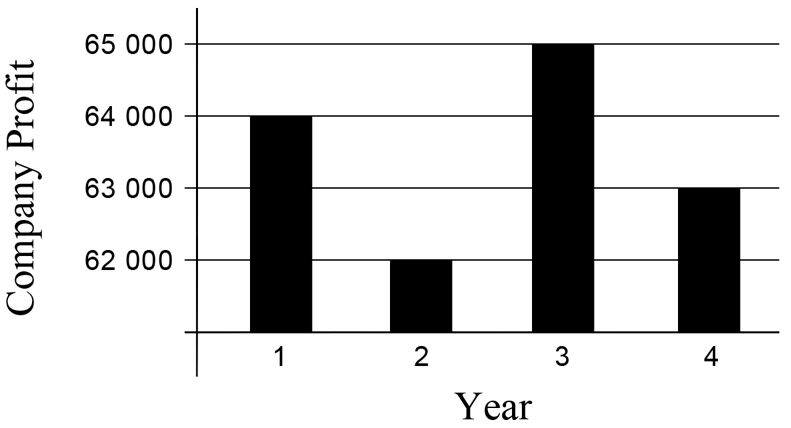
Statistics, NAP-J4-CA19
This graph shows a company's profit over a four year period.
Which conclusion can be reached from the graph?
|
|
The profit in Year 2 was one third of the profit in Year 1. |
|
|
The profit fell by 50% from Year 3 to Year 4. |
|
|
The profits were positive in Years 1 and 3, and negative in Years 2 and 4. |
|
|
The profits were greater than $60 000 in the period between Year 1 and Year 4. |

