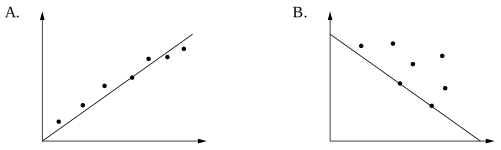
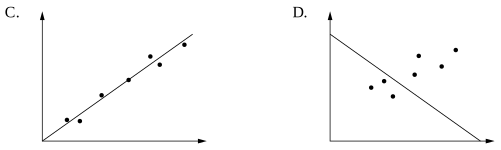
Each of the scatterplots shows the same number of data points.
Which scatterplot has the most appropriate line of best fit?
Aussie Maths & Science Teachers: Save your time with SmarterEd
Each of the scatterplots shows the same number of data points.
Which scatterplot has the most appropriate line of best fit?