Algae grows in a pond when sunlight and nutrients are present.
The mass of algae in the pond over a number of days is shown in the table.
| Time \(t\) (days) |
Mass \(A\) (mg) |
| \(0\) | \(5\) |
| \(1\) | \(40\) |
| \(2\) | \(320\) |
| \(3\) | \(2560\) |
| \(4\) | \(20\,480\) |
| \(5\) |
The equation to model the growth of the algae is given by
\(A=5\times2^{3t}\)
where \(A\) is the mass after a certain number of days in milligrams and \(t\) is the number of days elapsed.
- What was the mass of algae present in the pond on day 5? (1 mark)
--- 4 WORK AREA LINES (style=lined) ---
The first five rows of the table have been used to create part of the graph of \(A=5 \times 2^{3t}\) which is shown.
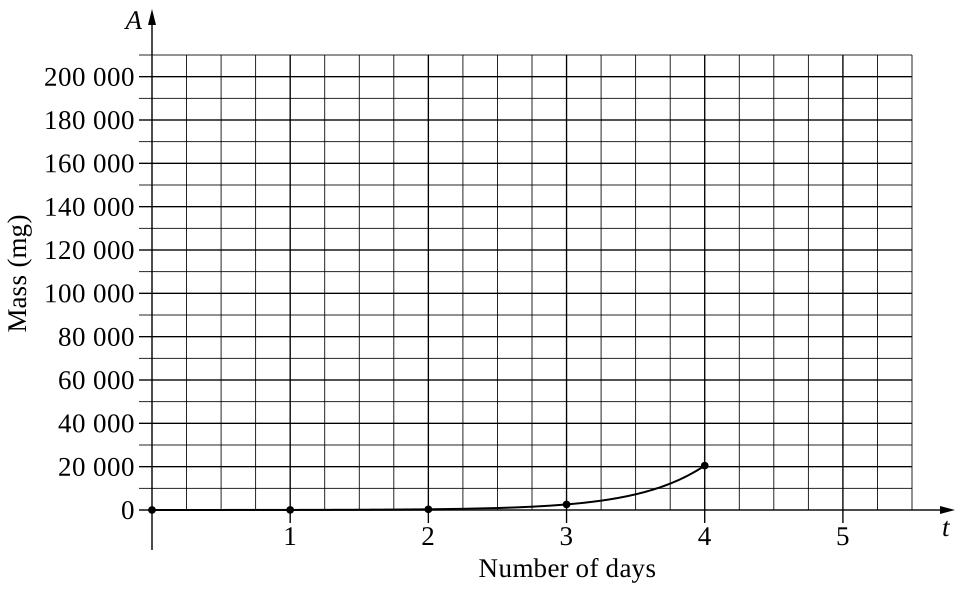
- Plot the mass found in part (a) and use this to complete the graph. (2 marks)
--- 0 WORK AREA LINES (style=lined) ---
- When does the mass of the algae reach 100 000 mg? Use your graph to estimate. (1 mark)
--- 2 WORK AREA LINES (style=lined) ---
a. \(163\,840\text{ mg}\)
b. \(\text{See the completed curve:}\)
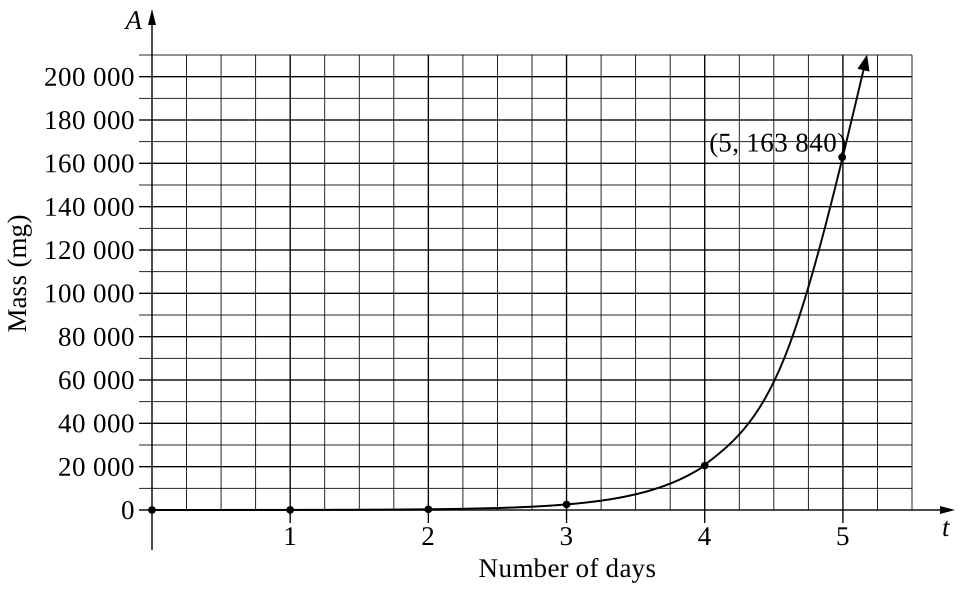
c. \(\text{Approximately 4.75 days}\)
| a. \(A\) | \(=5\times2^{3(5)}\) | |
| \(=5\times2^{15}\) | ||
| \(=163\,840\text{ mg}\) |
b. \(\text{See the completed curve:}\)
c. \(\text{From the graph:}\)
\(A=100\,000\text{ mg at approximately }t=4.75\text{ days.}\)