A scientist is studying a colony of bacteria in a laboratory. At the start of the experiment there are 500 bacteria.
Each hour the number of bacteria is modelled to be 1.25 times the number of the previous hour.
Let \(t=0\) be the start of the experiment.
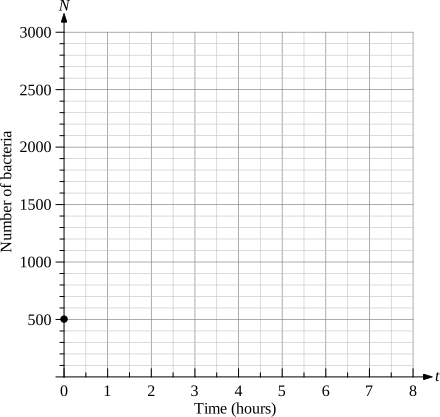
- By first completing the table of values below, draw a graph showing how the bacteria population is modelled from \(t=0\) to \(t=8\) hours. (3 marks)
--- 0 WORK AREA LINES (style=lined) ---
\(\begin{array}{|l|c|c|c|c|c|} \hline \rule{0pt}{2.5ex}t \ \text{(hours)} \rule[-1ex]{0pt}{0pt}& \ \ \quad 0 \ \ \quad & \ \ \quad 1 \ \ \quad & \ \ \quad 2 \ \ \quad & \ \ \quad 4 \ \ \quad & \ \ \quad 8 \ \ \quad \\ \hline \rule{0pt}{2.5ex}\text{Number of bacteria} \rule[-1ex]{0pt}{0pt}& 500 & & & & \\ \hline \end{array}\)
- Using your graph from (a), or otherwise, determine after how many hours the bacteria population first exceeds 2000. (1 mark)
--- 2 WORK AREA LINES (style=lined) ---
a. \(\text{Table of values:}\)
\(\text{Number of bacteria} = 500 \times 1.25^t\)
\(\begin{array}{|l|c|c|c|c|c|} \hline \rule{0pt}{2.5ex}t \ \text{(hours)} \rule[-1ex]{0pt}{0pt}& \ \ \quad 0 \quad \ \ & \ \ \quad 1 \ \ \quad & \ \ \quad 2 \ \ \quad & \ \ \quad 4 \ \ \quad & \ \ \quad 8 \ \ \quad \\ \hline \rule{0pt}{2.5ex}\text{Number of bacteria} \rule[-1ex]{0pt}{0pt}& 500 & \textbf{625} & \textbf{781} & \textbf{1221} & \textbf{2980} \\ \hline \end{array}\)
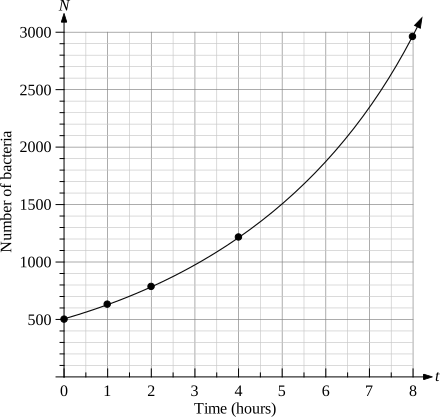
b. \(\text{From the graph, the bacteria population reaches 2000 at approximately }\ t \approx 6.25 \ \text{hours.}\)
a. \(\text{Table of values:}\)
\(\text{Number of bacteria} = 500 \times 1.25^t\)
\(\begin{array}{|l|c|c|c|c|c|} \hline \rule{0pt}{2.5ex}t \ \text{(hours)} \rule[-1ex]{0pt}{0pt}& \ \ \quad 0 \quad \ \ & \ \ \quad 1 \ \ \quad & \ \ \quad 2 \ \ \quad & \ \ \quad 4 \ \ \quad & \ \ \quad 8 \ \ \quad \\ \hline \rule{0pt}{2.5ex}\text{Number of bacteria} \rule[-1ex]{0pt}{0pt}& 500 & \textbf{625} & \textbf{781} & \textbf{1221} & \textbf{2980} \\ \hline \end{array}\)
b. \(\text{From the graph, the bacteria population reaches 2000 at approximately }\ t \approx 6.25 \ \text{hours.}\)