Statistics, NAP-K3-CA36
Statistics, NAP-K3-CA06
Clive and Alvin asked their friends how many books they had read in the past month.
Clive draws a picture graph to show the results for his friends.
Alvin draws a column graph to show the results for his friends.
How many more of Clive's friends read 3-4 books in the last month than Alvin's friends?
| `0` | `4` | `6` | `8` |
|
|
|
|
|
Statistics, NAP-I3-CA09
The graph shows the origin and type of all vehicles in a city.
Which statement is most accurate based on the graph?
|
|
There are more utility vehicles than trucks and vans. |
|
|
Utility vehicles are the most common type of vehicles |
|
|
There are more Australian vehicles than European vehicles. |
|
|
There are more Asian vehicles than European vehicles. |
Statistics, NAP-A3-CA01 SA
Statistics, NAP-J3-CA26
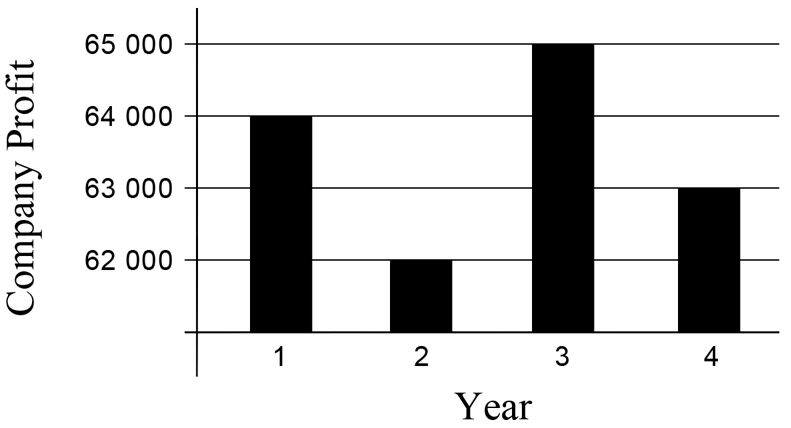
This graph shows a company's profit over a four year period.
Which conclusion can be reached from the graph?
|
|
The profit in Year 2 was one third of the profit in Year 1. |
|
|
The profit fell by 50% from Year 3 to Year 4. |
|
|
The profits were positive in Years 1 and 3, and negative in Years 2 and 4. |
|
|
The profits were greater than $60 000 in the period between Year 1 and Year 4. |
Statistics, NAP-J3-CA17
The bottles in Renee's fridge are pictured below.
Renee decides to make a graph where each bar represents one type of bottle in her fridge.
Renee makes an error when creating the graph.
What should Renee do to correct the error?
|
|
Make each category bar a different colour. |
|
|
Change the title to 'Number of bottles in the fridge by volume'. |
|
|
Change the 'Number of bottles' label to 'Volume of bottles'. |
|
|
Remove the 'Juice' category since orange juice and apple juice are already shown. |
Statistics, NAP-D3-NC01
Statistics, NAP-E3-NC19 SA
Statistics, NAP-G3-CA27 SA
Statistics, NAP-H3-CA08
Statistics, NAP-I3-NC09
Statistics, NAP-C3-NC28
Each bar on this graph shows the population of a country and the population of its capital city.
The white section is the population that lives in the capital city.
The black section is the population that lives outside the capital city.
Which of the following countries has the highest percentage of its population living in its capital city?
|
|
`text(Australia)` |
|
|
`text(Belgium)` |
|
|
`text(France)` |
|
|
`text(England)` |


