SmarterEd

Aussie Maths & Science Teachers: Save your time with SmarterEd

  • Login
  • Get Help
  • About

Statistics, STD2 2026 HSC 22

Researchers were interested in whether the critics' scores for movies could be used to predict the general public's scores for movies.

A random sample of movies was selected, and the average score from the critics and the average score from the public were recorded.

A scatterplot of the dataset and the least-squares regression line are shown.
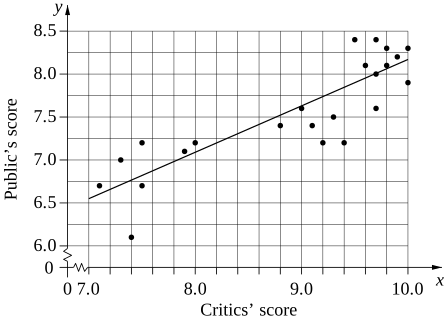
 

  1. What was the lowest score given by the public for a movie, correct to 1 decimal place?   (1 mark)

    --- 2 WORK AREA LINES (style=lined) ---

  2. The gradient of the least-squares regression line for the dataset is 0.54.
  3. Interpret the gradient in the context of the dataset.   (2 marks)

    --- 4 WORK AREA LINES (style=lined) ---

  4. A new data point is included in the dataset. The critics' score is 7.2 and the public's score is 6.
  5. Identify ONE effect this would have on the least-squares regression line.   (1 mark)

    --- 2 WORK AREA LINES (style=lined) ---

Show Answers Only

a.    \(6.1\)

 
b.
    \(\text{Interpretation of gradient = 0.54:}\)

\(\text{For each 1-point increase in the critics’ score, the predicted public’s}\)

\(\text{score increases by 0.54 points.}\)
 

c.    \(\text{The new point lies below the LSRL.}\)

\(\text{Possible effects could include:}\)

\(\text{- lowering the LSRL at each critic’s score.}\)

\(\text{- increasing the LSRL gradient (its LHS will be relatively lower than its RHS).}\)

Show Worked Solution
a.     \(\text{Lowest public score}\) \(=\ \text{$y$-value of the lowest plotted point}\)
    \(=6.1\)

 
b.
    \(\text{Interpretation of gradient = 0.54:}\)

\(\text{For each 1-point increase in the critics’ score, the predicted public’s}\)

\(\text{score increases by 0.54 points.}\)
 

c.    \(\text{The new point lies below the LSRL.}\)

\(\text{Possible effects could include:}\)

\(\text{- lowering the LSRL at each critic’s score.}\)

\(\text{- increasing the LSRL gradient (its LHS will be relatively lower than its RHS).}\)

Filed Under: Bivariate Data Analysis (Y12) Tagged With: Band 3, Band 4, smc-6934-20-LSRL, smc-6934-50-Gradient Interpretation

Copyright © 2014–2026 SmarterEd.com.au · Log in