The life span of light globes from a particular factory is normally distributed with a mean of 840 hours and a standard deviation of 80 hours.
Light globes which have a life span between 600 hours and 712 hours are considered to have a short life span.
Light globes which have a life span between 1000 hours and 1112 hours are considered to have a long life span.
Explain, with reference to areas under the normal distribution curve, whether the number of light globes with a short life span is expected to be more or less than the number of light globes with a long life span. (3 marks)
--- 8 WORK AREA LINES (style=lined) ---
\(\text{Sketch the normal curve:}\ \mu=840, \ \sigma=80\)
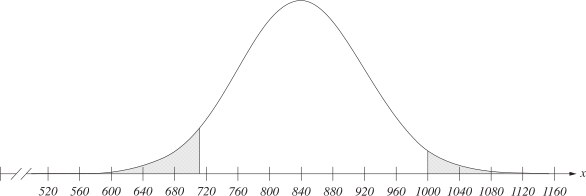
\(\text{Since the area shown for the “short life span” is closer to the mean,}\)
\(\text{it is a larger area. It can therefore be expected that there are more}\)
\(\text{light globes with a short life span than with a long life span.}\)
\(\text{Sketch the normal curve:}\ \mu=840, \ \sigma=80\)
\(\text{Since the area shown for the “short life span” is closer to the mean,}\)
\(\text{it is a larger area. It can therefore be expected that there are more}\)
\(\text{light globes with a short life span than with a long life span.}\)