SmarterEd

Aussie Maths & Science Teachers: Save your time with SmarterEd

  • Login
  • Get Help
  • About

Statistics, STD2 EQ-Bank 35

The life span of light globes from a particular factory is normally distributed with a mean of 840 hours and a standard deviation of 80 hours.

Light globes which have a life span between 600 hours and 712 hours are considered to have a short life span.

Light globes which have a life span between 1000 hours and 1112 hours are considered to have a long life span.

Explain, with reference to areas under the normal distribution curve, whether the number of light globes with a short life span is expected to be more or less than the number of light globes with a long life span.   (3 marks)
 

--- 8 WORK AREA LINES (style=lined) ---

Show Answers Only

\(\text{Sketch the normal curve:}\ \mu=840, \ \sigma=80\)
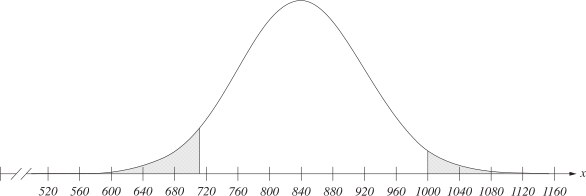
 

\(\text{Since the area shown for the “short life span” is closer to the mean,}\)

\(\text{it is a larger area. It can therefore be expected that there are more}\)

\(\text{light globes with a short life span than with a long life span.}\)
Show Worked Solution

\(\text{Sketch the normal curve:}\ \mu=840, \ \sigma=80\)


\(\text{Since the area shown for the “short life span” is closer to the mean,}\)

\(\text{it is a larger area. It can therefore be expected that there are more}\)

\(\text{light globes with a short life span than with a long life span.}\)
Filed Under: The Normal Distribution (Y12) Tagged With: Band 5, smc-6919-40-Graphs

Statistics, STD2 S5 2023 HSC 18

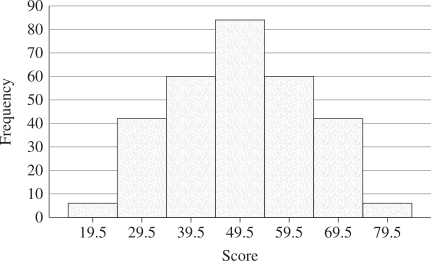
The histogram shows a summary of scores on a test.
 

Provide TWO features of the histogram that indicate that the data comes from a normal distribution.   (2 marks)

Show Answers Only

`text{Choose two from the following features:}`

    • `text{Data distribution is symmetrical about the mean}`
    • `text{Mean = median = mode}`
    • `text{Histogram has only a single peak}`
Show Worked Solution

`text{Choose two from the following features:}`

    • `text{Data distribution is symmetrical about the mean}`
    • `text{Mean = median = mode}`
    • `text{Histogram has only a single peak}`
♦♦ Mean mark 31%.

Filed Under: S5 The Normal Distribution (Y12), The Normal Distribution (Y12) Tagged With: Band 5, smc-6919-40-Graphs, smc-819-40-Graphs

Statistics, 2ADV S3 2020 HSC 9 MC

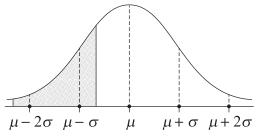
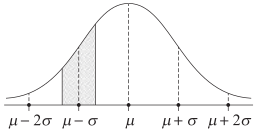
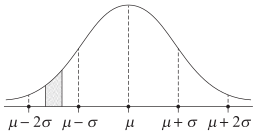
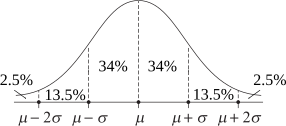
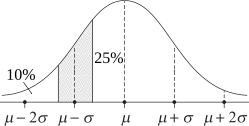
Suppose the weight of melons is normally distributed with a mean of `mu` and a standard deviation of `sigma`.

A melon has a weight below the lower quartile of the distribution but NOT in the bottom 10% of the distribution.

Which of the following most accurately represents the region in which the weight of this melon lies?
 

A. B.
C. D.
Show Answers Only

`C`

Show Worked Solution

`text(Distributions using)\ mu and sigma:`


`text(Adjusting the above to identify the interval  10% < weight < 25%)`

  
`=>C`

Filed Under: Normal Distribution, The Normal Distribution, The Normal Distribution (Y12) Tagged With: Band 4, common-content, smc-6919-20-z-score Intervals, smc-6919-40-Graphs, smc-7138-20-z-score Intervals, smc-7138-40-Graphs, smc-995-20-z-score Intervals, smc-995-40-Graphs

Statistics, STD2 S5 2019 HSC 15 MC

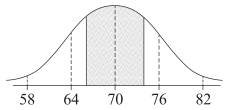
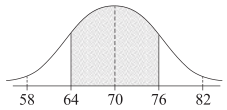
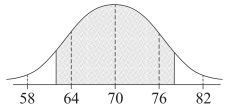
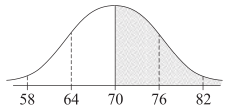
The scores on an examination are normally distributed with a mean of 70 and a standard deviation of 6. Michael received a score on the examination between the lower quartile and the upper quartile of the scores.

Which shaded region most accurately represents where Michael's score lies?
 

A.
 
B.
 
C. D.
Show Answers Only

`A`

Show Worked Solution

`text{68% of marks lie between 64 and 76 (mean ± 1 σ).}`

♦♦♦ Mean mark 17%.

`text(50% of marks lie between)\ Q_1\ text(and)\ Q_3.`

`=> A`

Filed Under: Normal Distribution, S5 The Normal Distribution (Y12), The Normal Distribution (Y12) Tagged With: Band 6, common-content, smc-6919-20-z-score Intervals, smc-6919-40-Graphs, smc-819-20-z-score Intervals, smc-819-40-Graphs, smc-995-20-z-score Intervals, smc-995-40-Graphs

Statistics, STD2 S5 2004 HSC 24c

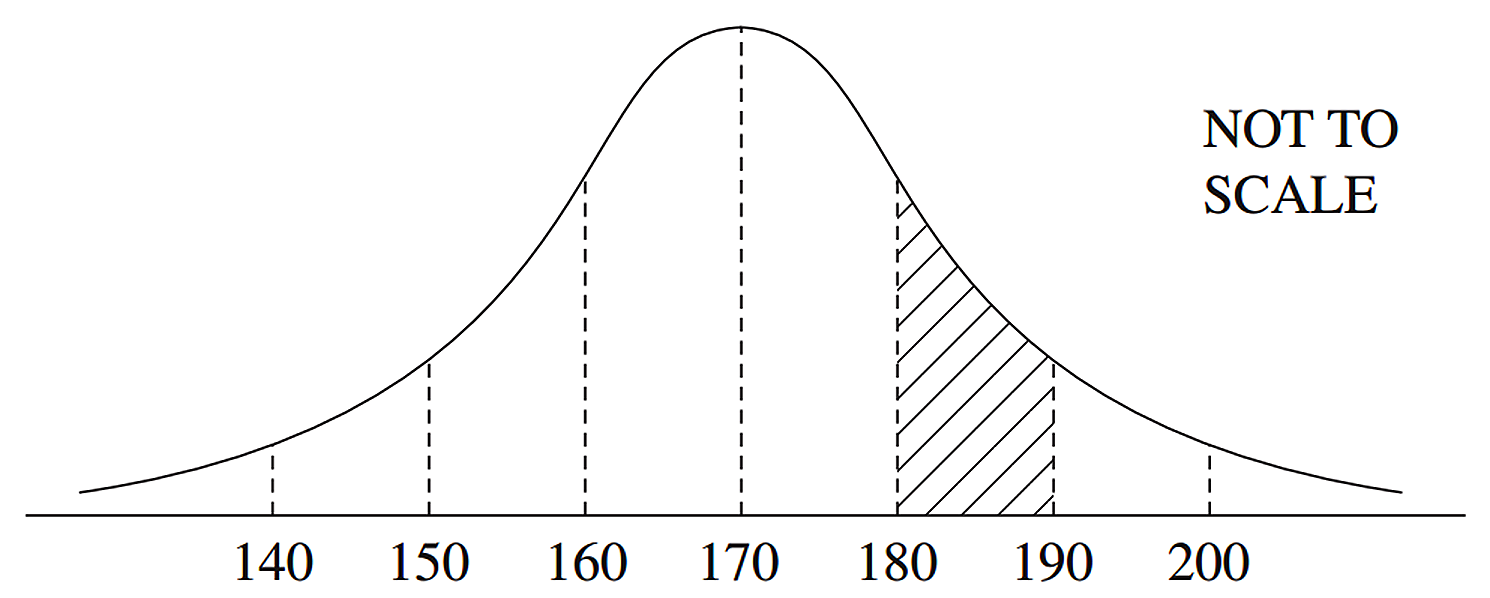
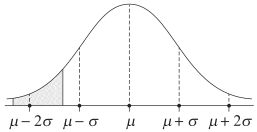
The normal distribution shown has a mean of 170 and a standard deviation of 10.
 

  1. Roberto has a raw score in the shaded region. What could his `z`-score be?   (1 mark)

    --- 1 WORK AREA LINES (style=lined) ---

  2. What percentage of the data lies in the shaded region?   (2 marks)

    --- 4 WORK AREA LINES (style=lined) ---

Show Answers Only

a.    `1 <= text(z-score) <= 2`

b.    `text(13.5%)`

Show Worked Solution

a.    `ztext{-score(180)}= (x-mu)/sigma= (180-170)/10= 1`

`ztext{-score(190)}= (190-170)/10= 2`

 `:. 1 <= ztext(-score) <= 2`


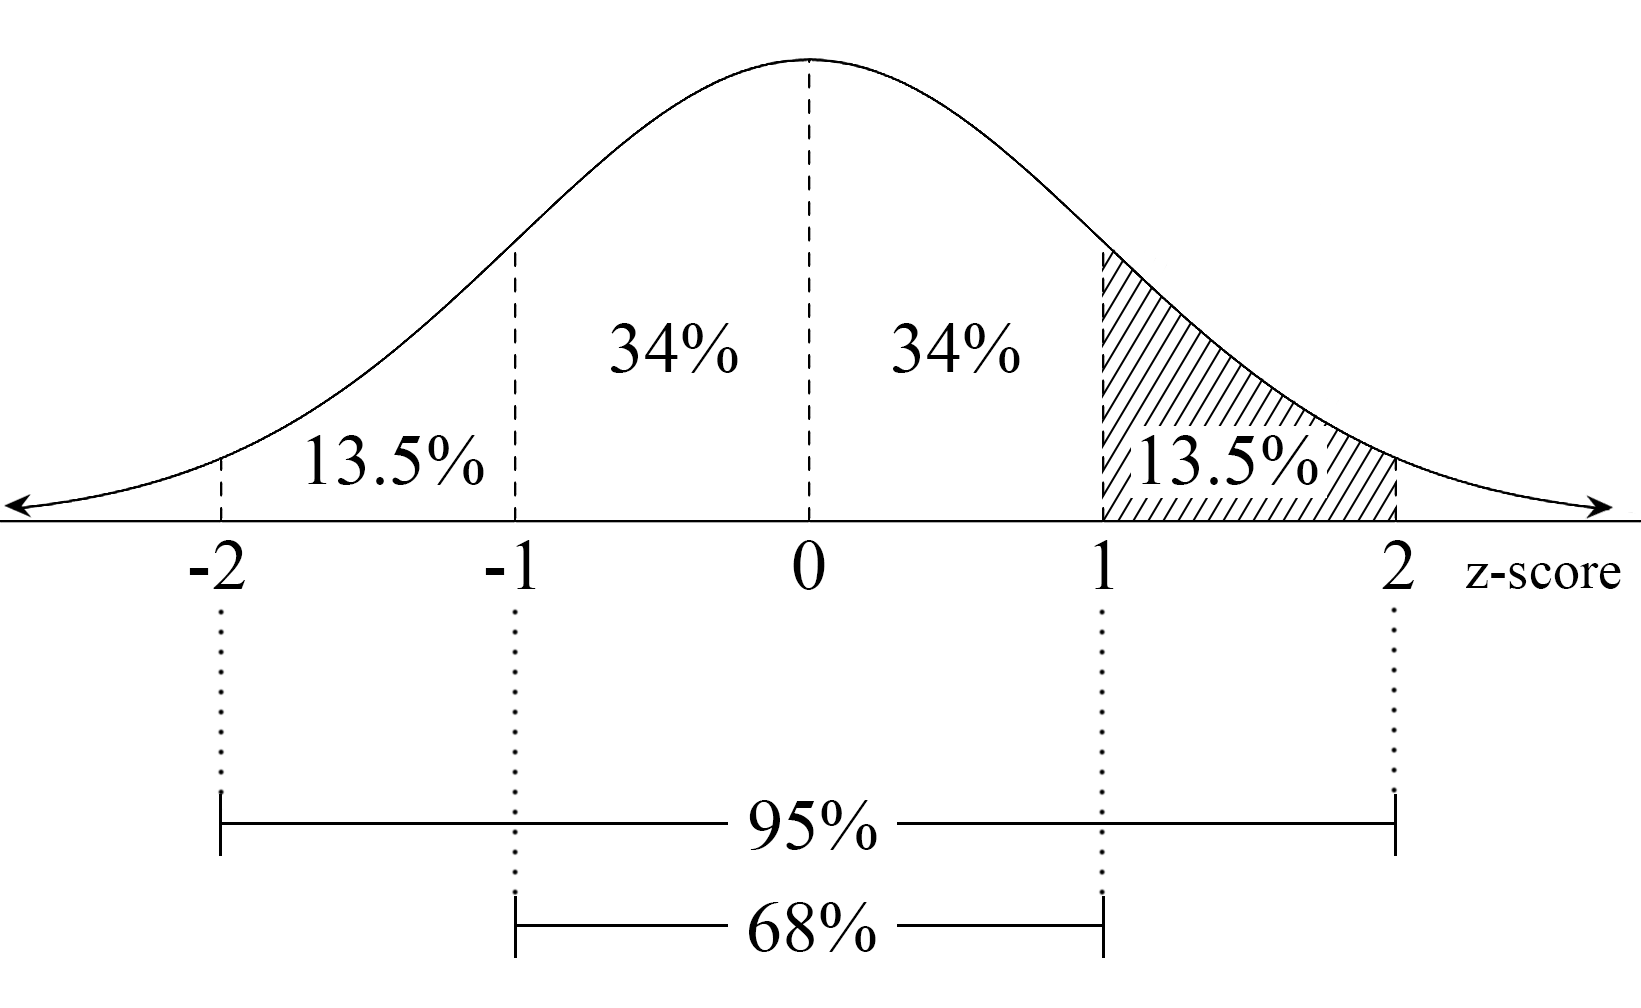
b.    

`text(From the graph above:)`

`text(13.5% lies in the shaded area.)`

Filed Under: DS5/6 - Normal Distribution and Sampling, Normal Distribution, S5 The Normal Distribution (Y12), The Normal Distribution (Y12) Tagged With: Band 4, Band 5, common-content, smc-6919-20-z-score Intervals, smc-6919-40-Graphs, smc-819-20-z-score Intervals, smc-819-40-Graphs, smc-995-20-z-score Intervals, smc-995-40-Graphs

Statistics, STD2 S5 2010 HSC 4 MC

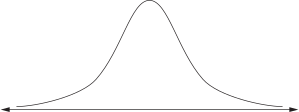
Which of the following frequency histograms shows data that could be normally distributed?
 

Capture1

Capture2 

Show Answers Only

`A`

Show Worked Solution

`text(Normally distributed data have a frequency)`

`text(histogram graph that is shaped like a bell.)`

`=>  A`

Filed Under: Bar Charts and Histograms, Bar Charts and Histograms, Bar Charts and Histograms, Displaying Data - Bar Charts and Histograms, DS5/6 - Normal Distribution and Sampling, Normal Distribution, S5 The Normal Distribution (Y12), The Normal Distribution (Y12) Tagged With: Band 4, common-content, smc-6310-20-Histograms, smc-6919-40-Graphs, smc-819-40-Graphs, smc-821-15-Histograms, smc-995-40-Graphs, smc-997-15-Histograms

Copyright © 2014–2026 SmarterEd.com.au · Log in