SmarterEd

Aussie Maths & Science Teachers: Save your time with SmarterEd

  • Login
  • Get Help
  • About

Statistics, STD2 EQ-Bank 35

The life span of light globes from a particular factory is normally distributed with a mean of 840 hours and a standard deviation of 80 hours.

Light globes which have a life span between 600 hours and 712 hours are considered to have a short life span.

Light globes which have a life span between 1000 hours and 1112 hours are considered to have a long life span.

Explain, with reference to areas under the normal distribution curve, whether the number of light globes with a short life span is expected to be more or less than the number of light globes with a long life span.   (3 marks)
 

--- 8 WORK AREA LINES (style=lined) ---

Show Answers Only

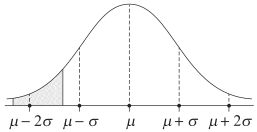
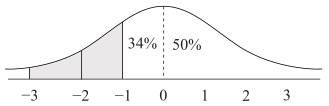
\(\text{Sketch the normal curve:}\ \mu=840, \ \sigma=80\)
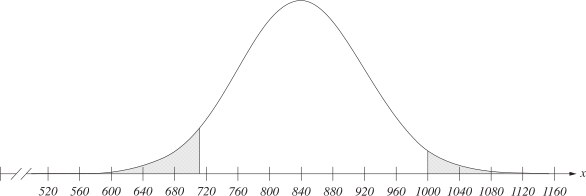
 

\(\text{Since the area shown for the “short life span” is closer to the mean,}\)

\(\text{it is a larger area. It can therefore be expected that there are more}\)

\(\text{light globes with a short life span than with a long life span.}\)

Show Worked Solution

\(\text{Sketch the normal curve:}\ \mu=840, \ \sigma=80\)


\(\text{Since the area shown for the “short life span” is closer to the mean,}\)

\(\text{it is a larger area. It can therefore be expected that there are more}\)

\(\text{light globes with a short life span than with a long life span.}\)
Filed Under: The Normal Distribution (Y12) Tagged With: Band 5, smc-6919-40-Graphs

Statistics, STD2 EQ-Bank 13 MC

Sales of a product on any given day are normally distributed with a mean of $100 and a standard deviation of $8.

Out of 200 days, on how many days would the sales be expected to be between $84 and $108?

  1. 82
  2. 95
  3. 163
  4. 190
Show Answers Only

\(C\)

Show Worked Solution

\(z\text{-score \$84} = \dfrac{84-100}{8}=-2\)

\(z\text{-score \$108} = \dfrac{108-100}{8}=1\)

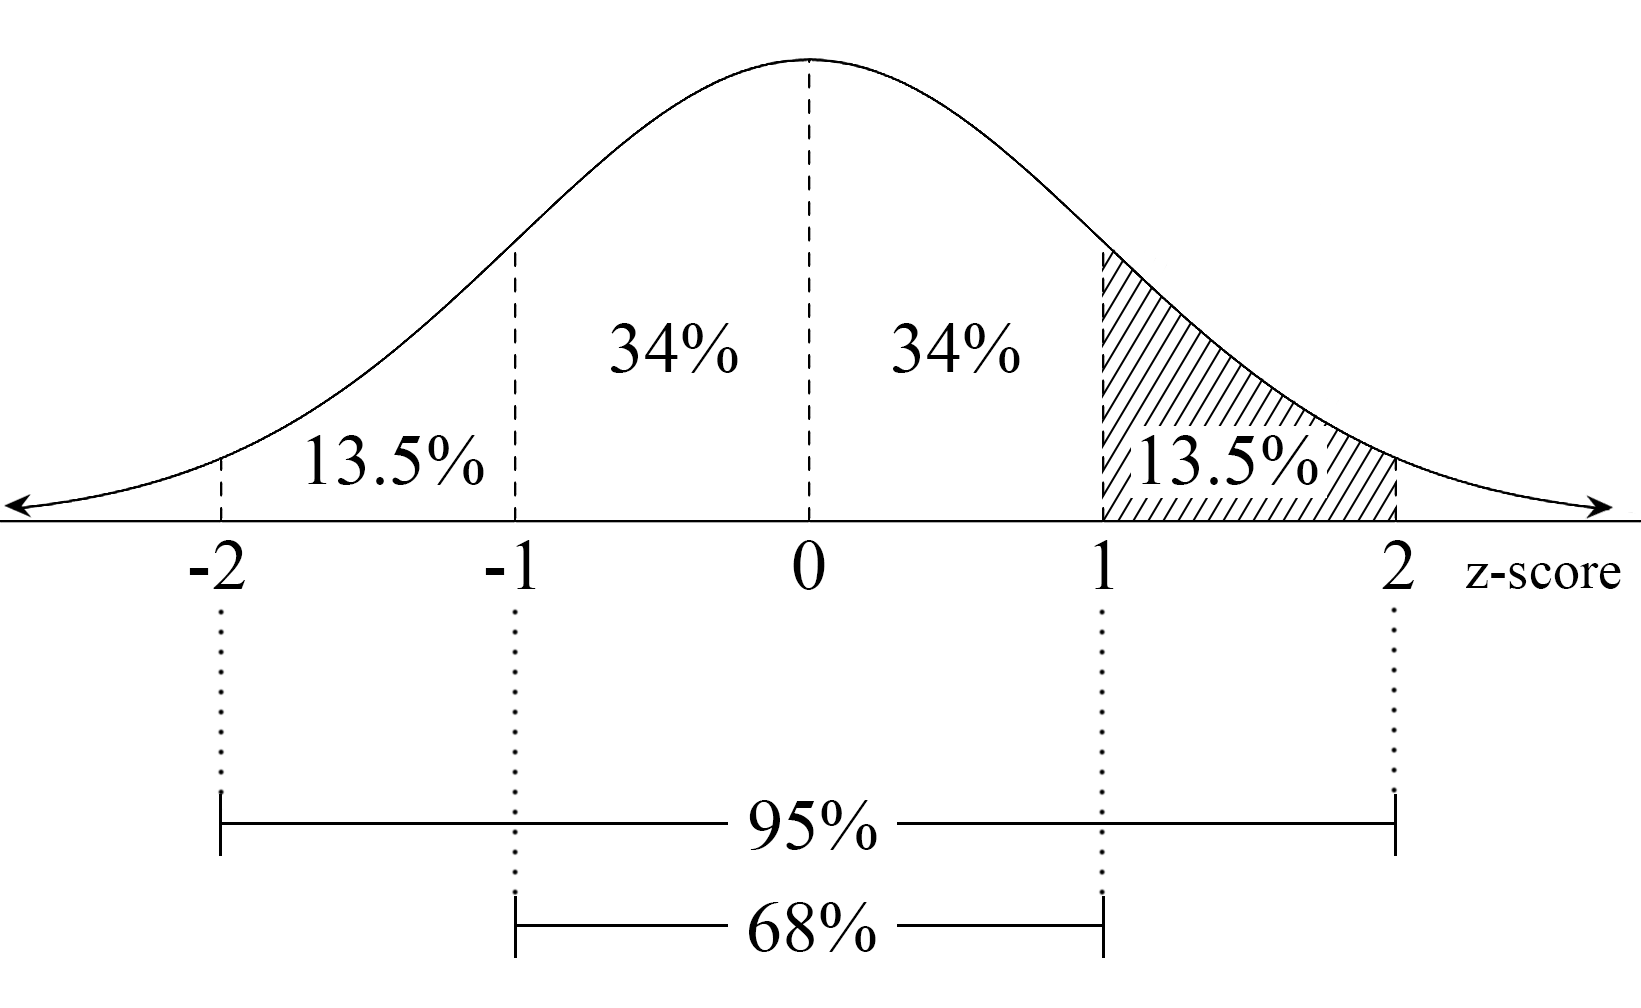
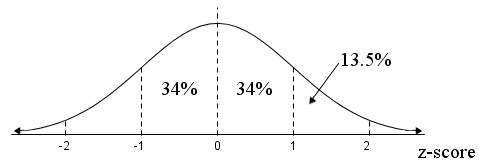
\(\text{\% days between \(z\)-score 1 and}\ -2 = 68+13.5=81.5% \)

core 2008 VCAA 6-7

\(\text{Number of days} = 0.815 \times 200 = 163\)

\(\Rightarrow C\)

Filed Under: The Normal Distribution (Y12) Tagged With: Band 5, smc-6919-20-z-score Intervals

Statistics, STD2 S5 2025 HSC 40

  1. In a flock of 12 600 sheep, the ratio of males to females is \(1:20\).
  2. The weights of the male sheep are normally distributed with a mean of 76.2 kg and a standard deviation of 6.8 kg.
  3. In the flock, 15 of the male sheep each weigh more than \(x\) kg. 
  4. Find the value of \(x\).   (4 marks)

    --- 10 WORK AREA LINES (style=lined) ---

  5. The weights of the female sheep are also normally distributed but have a smaller mean and smaller standard deviation than the weights of male sheeр.
  6. Explain whether it could be expected that 300 of the females from the flock each weigh more than \(x\) kg, where \(x\) is the value found in part (a).   (1 mark)

    --- 6 WORK AREA LINES (style=lined) ---

Show Answers Only

a.   \(x=89.8 \ \text{kg}\)

b.    \(\text{Female sheep} \ \%=\dfrac{300}{12\,000}=0.025 \%\ (z \text{-score = 2)}\)

\(\text{Given} \ \ \bar{x}_f<\bar{x}_m \ \ \text{and} \ \ s_f<s_m\)

\(\text{Consider the value of}\ x_f\ \text{when \(z\)-score = 2}:\)

\(\Rightarrow x_f=\bar{x}_f+2 \times s_f \leq x_m\)

\(\therefore \ \text{It is not expected that  300 females weigh > 89.8 kg.}\)

Show Worked Solution

a.    \(12\,600 \ \text{sheep} \ \Rightarrow \ \text{male : female}=1:20\)

\(\text{Number of sheep in “1 part”} = \dfrac{12\,600}{21}=600\)

\(\Rightarrow \ \text{male : female}=600:12\,000\)

\(\text{male sheep} \ \%=\dfrac{15}{600}=0.025\%\)

\(z \text{-score }(0.025 \%)=2\)

\(\text{Using } \ z=\dfrac{x-\bar{x}}{s}, \ \text{find} \ \ x_m:\)

\(2\) \(=\dfrac{x_m-76.2}{6.8}\)  
\(x_m\) \(=76.2+2 \times 6.8=89.8 \ \text{kg}\)  
♦♦ Mean mark (a) 35%.

b.    \(\text{Female sheep} \ \%=\dfrac{300}{12\,000}=0.025 \%\ (z \text{-score = 2)}\)

\(\text{Given} \ \ \bar{x}_f<\bar{x}_m \ \ \text{and} \ \ s_f<s_m\)

\(\text{Consider the value of}\ x_f\ \text{when \(z\)-score = 2}:\)

\(\Rightarrow x_f=\bar{x}_f+2 \times s_f \leq x_m\)

\(\therefore \ \text{It is not expected that 300 females weigh > 89.8 kg.}\)

♦♦♦ Mean mark (b) 6%.

Filed Under: S5 The Normal Distribution (Y12), The Normal Distribution (Y12) Tagged With: 2adv-std2-common, Band 5, Band 6, smc-6919-10-Single z-score, smc-819-10-Single z-score

Statistics, STD2 S5 2025 HSC 15 MC

The minimum daily temperature, in degrees, of a town each year follows a normal distribution with its mean equal to its standard deviation. The minimum daily temperature was recorded over one year.

What percentage of the recorded minimum daily temperatures was above zero degrees?

  1. 16%
  2. 50%
  3. 68%
  4. 84%
Show Answers Only

\(D\)

Show Worked Solution

\(\text{Consider a possible example:}\)

\(\text{Let mean min daily temperature = 8°C}\)

\(\text{Std dev = 8°C}\)

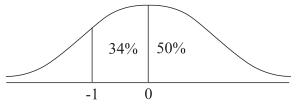
\(z\text{-score (0°C)}\ =-1\)

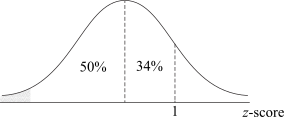
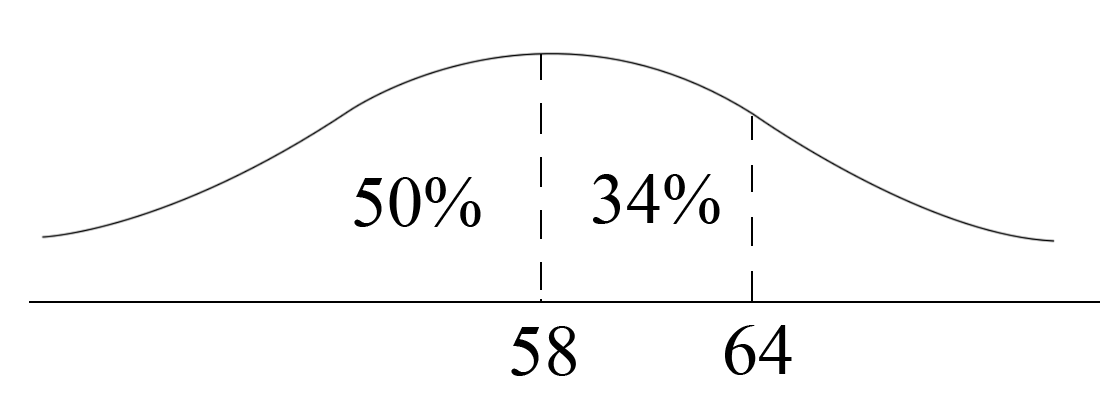
\(\text{Percentage above 0°C} = 50+34=84\%\)

\(\Rightarrow D\)

♦♦♦ Mean mark 25%.

Filed Under: S5 The Normal Distribution (Y12), The Normal Distribution (Y12) Tagged With: Band 6, smc-6919-10-Single z-score, smc-819-10-Single z-score

Statistics, STD2 S5 2024 GEN2 3

The time difference between successive high tides and low tides is approximately normally distributed.

Analysis of the 2021 tide chart showed that

  • 99.85% of the time differences are more than 4.88 hours
  • 16% of the time differences are less than 5.76 hours.

Determine the mean and standard deviation for this normal distribution.   (3 marks)

--- 6 WORK AREA LINES (style=lined) ---

Show Answers Only

\(\sigma=0.44, \ \overline{x}=6.2\)

Show Worked Solution

\(\text{99.85% of the time differences are more than 4.88 hours:}\)

\(-3=\dfrac{4.88-\overline{x}}{\sigma}\ \ \Rightarrow \ -3 \times \sigma=4.88-\overline{x}\ …\ (1)\)

\(\text{16% of the time differences are less than 5.76 hours:}\)

\(-1=\dfrac{5.76-\overline{x}}{\sigma}\ \ \Rightarrow \ -\sigma=5.76-\overline{x}\ …\ (2)\)

\(\text{Subtract}\ (2)-(1):\)

\(2\sigma\) \(=0.88\)  
\(\sigma\) \(=0.44\)  

 
\(\text{Substitute into (2):}\)

\(\overline{x}=5.76+0.44=6.2\)

Filed Under: S5 The Normal Distribution (Y12), The Normal Distribution (Y12) Tagged With: Band 5, smc-6919-10-Single z-score, smc-819-10-Single z-score

Statistics, STD2 S5 2024 GEN1* 6 MC

The weights of cans of fish on a production line are approximately normally distributed with a mean of 126.4 grams and a standard deviation of 2.4 grams.

13 600 cans of fish will be produced today.

The number of these cans that are expected to weigh between 121.6 and 128.8 grams is

  1. 6460
  2. 9248
  3. 10 812
  4. 11 084
Show Answers Only

\(D\)

Show Worked Solution

\(z\text{-score (121.6)} = \dfrac{121.6-126.4}{2.4}=-2 \)

\(z\text{-score (128.8)} = \dfrac{128.8-126.4}{2.4}=1 \)

\(\text{% between 121.6 and 128.8 = 47.5 + 34 = 81.5%} \)

\(\text{Number of cans}\ =0.815 \times 13\,600 = 11\,084\)

\(\Rightarrow D\)

Filed Under: S5 The Normal Distribution (Y12), The Normal Distribution (Y12) Tagged With: Band 4, smc-6919-20-z-score Intervals, smc-819-20-z-score Intervals

Statistics, STD2 S5 2024 GEN1* 5 MC

The heights of a group of Year 9 students were measured and the standard deviation was found to be 12.25 cm .

One student with a height of 174.6 cm had a standardised score of  \(z=0.45\)

The mean height of this group of students, in centimetres, was closest to

  1. 161.9
  2. 169.1
  3. 180.1
  4. 186.4
Show Answers Only

\(B\)

Show Worked Solution

\(\text{Using}\ \ z=\dfrac{x-\mu}{\sigma}: \)

\(0.45\) \(=\dfrac{174.6-\mu}{12.25} \)  
\(\mu\) \(=174.6-(0.45 \times 12.25) = 169.0875\)  

 
\(\Rightarrow B\)

Filed Under: S5 The Normal Distribution (Y12), The Normal Distribution (Y12) Tagged With: Band 4, smc-6919-10-Single z-score, smc-819-10-Single z-score

Statistics, STD2 S5 2024 GEN1 7 MC

Fiona plays nine holes of golf each week, and records her score.

Her mean score for all rounds in 2024 is 55.7

In one round, when she recorded a score of 48, her standardised score was  \(z=-1.75\)

The standard deviation for score in 2024 is

  1. 1.1
  2. 2.3
  3. 4.4
  4. 6.95
Show Answers Only

\(C\)

Show Worked Solution

\(\mu=55.7, \ z=-1.75\)

\(z\) \(=\dfrac{x-\mu}{\sigma}\)
\(-1.75\) \(=\dfrac{48-55.7}{\sigma}\)
\(\sigma\) \(=\dfrac{48-55.7}{-1.75}\)
  \(=4.4\)

  
\(\Rightarrow C\)

Filed Under: S5 The Normal Distribution (Y12), The Normal Distribution (Y12) Tagged With: Band 4, smc-6919-10-Single z-score, smc-819-10-Single z-score

Statistics, STD2 S5 2024 HSC 5 MC

Pia's marks in Year 10 assessments are shown. The scores for each subject were normally distributed.

\begin{array}{|l|c|c|c|}
\hline & \textit {Pia's mark} & \textit {Year 10 mean} & \textit {Year 10 standard} \\
&&&\textit {deviation}\\
\hline \text {English} & 78 & 66 & 6 \\
\hline \text {Mathematics} & 80 & 71 & 10 \\
\hline \text {Science} & 77 & 70 & 15 \\
\hline \text {History} & 85 & 72 & 9 \\
\hline
\end{array}

In which subject did Pia perform best in comparison with the rest of Year 10?

  1. English
  2. Mathematics
  3. Science
  4. History
Show Answers Only

\(A\)

Show Worked Solution

\(\text {Consider the z-score of each option:}\)

\(z \text {-score (English)}=\dfrac{78-66}{6}=2\)

\(z \text {-score (Maths)}=\dfrac{80-71}{10}=0.9\)

\(z \text {-score (Science) }=\dfrac{77-70}{15}=0.46 \ldots\)

\(z \text {-score (History})=\dfrac{85-72}{9}=1.4 \ldots\)

\(\Rightarrow A\)

Filed Under: S5 The Normal Distribution (Y12), The Normal Distribution (Y12) Tagged With: 2adv-std2-common, Band 4, smc-6919-30-Comparisons of Data Sets, smc-819-30-Comparisons of Data Sets

Statistics, STD2 S5 2023 HSC 18

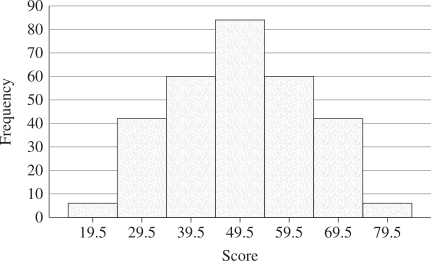
The histogram shows a summary of scores on a test.
 

Provide TWO features of the histogram that indicate that the data comes from a normal distribution.   (2 marks)

Show Answers Only

`text{Choose two from the following features:}`

    • `text{Data distribution is symmetrical about the mean}`
    • `text{Mean = median = mode}`
    • `text{Histogram has only a single peak}`
Show Worked Solution

`text{Choose two from the following features:}`

    • `text{Data distribution is symmetrical about the mean}`
    • `text{Mean = median = mode}`
    • `text{Histogram has only a single peak}`
♦♦ Mean mark 31%.

Filed Under: S5 The Normal Distribution (Y12), The Normal Distribution (Y12) Tagged With: Band 5, smc-6919-40-Graphs, smc-819-40-Graphs

Statistics, STD2 S5 2023 HSC 2 MC

In a normal distribution, what is the approximate percentage of scores with a `z`-score less than 1 ?

  1. 50%
  2. 68%
  3. 84%
  4. 97.5%
Show Answers Only

`C`

Show Worked Solution

`P(z<0)=0.5`

`P(0<z<1)=0.34`

`:.P(z<1)=0.5+0.34=0.84`

`=>C`

Surprisingly low mean mark of 57%.

Filed Under: S5 The Normal Distribution (Y12), The Normal Distribution (Y12) Tagged With: Band 4, smc-6919-10-Single z-score, smc-819-10-Single z-score

Statistics, STD2 S5 2022 HSC 37

The life span of batteries from a particular factory is normally distributed with a mean of 840 hours and a standard deviation of 80 hours.

It is known from statistical tables that for this distribution approximately 60% of the batteries have a life span of less than 860 hours.

What is the approximate percentage of batteries with a life span between 820 and 920 hours?   (3 marks)

--- 6 WORK AREA LINES (style=lined) ---

Show Answers Only

`44text{%}`

Show Worked Solution

`mu=840, \ sigma=80`

`ztext{-score (860)}\ = (x-mu)/sigma=(860-840)/80=0.25` 

`ztext{-score (820)}\ =(820-840)/80=-0.25` 

`ztext{-score (920)}\ =(920-840)/80=1`
 

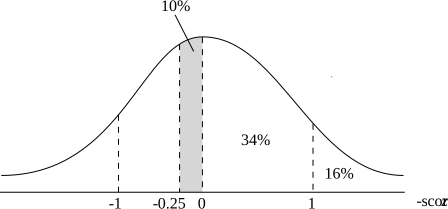
`text{50% of batteries have a life span below 840 hours (by definition)}`

`=>\ text{10% lie between 840 and 860 hours}`

`=>\ text{By symmetry, 10% lie between 820 and 840 hours}`

`=> P(-0.25<=z<=0)=10text{%}`
 

`:.\ text{Percentage between 820 and 920}`

`=P(-0.25<=z<=1)`

`=P(-0.25<=z<=0) + P(0<=z<=1)`

`=10+34=44text{%}`


♦♦ Mean mark 28%.

Filed Under: S5 The Normal Distribution (Y12), The Normal Distribution (Y12) Tagged With: 2adv-std2-common, Band 5, common-content, smc-6919-20-z-score Intervals, smc-819-20-z-score Intervals

Statistics, STD2 S5 2022 HSC 18

The marks in a test were normally distributed. The mean mark was 60 and the standard deviation was 15 .

What was the percentage of marks higher than 90?   (2 marks)

--- 4 WORK AREA LINES (style=lined) ---

Show Answers Only

`2.5text{%}`

Show Worked Solution
`ztext{-score}` `=(x-mu)/sigma`
  `=(90-60)/15=2`


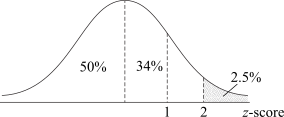
`text{% marks > 90}\ = 2.5text{%}`


Mean mark 52%.
COMMENT: A poor State result that warrants attention.

Filed Under: S5 The Normal Distribution (Y12), The Normal Distribution (Y12) Tagged With: Band 4, common-content, smc-6919-10-Single z-score, smc-819-10-Single z-score

Statistics, STD2 S5 EQ-Bank 22

800 participants auditioned for a stage musical. Each participant was required to complete a series of ability tests for which they received an overall score.

The overall scores were approximately normally distributed with a mean score of 69.5 points and a standard deviation of 6.5 points.

Only the participants who scored at least 76.0 points in the audition were considered successful.

How many of the participants were considered unsuccessful?   (2 marks)

Show Answers Only

`672`

Show Worked Solution

`mu = 69.5 \ , \ sigma= 6.5`

`ztext{-score} (76) = {76-69.5}/6.5 = 1`

`:.\  text{Unsuccessful}=84text(%) xx 800= 672`

Filed Under: S5 The Normal Distribution (Y12), The Normal Distribution (Y12) Tagged With: Band 4, common-content, smc-6919-10-Single z-score, smc-819-10-Single z-score

Statistics, STD2 S5 2021 HSC 8 MC

On a test, Zac's mark corresponded to a `z`-score of 2. The test scores had a mean of 63 and a standard deviation of 8.

What was Zac's actual mark on the test?

  1. 65
  2. 67
  3. 73
  4. 79
Show Answers Only

`D`

Show Worked Solution

`text{Method 1 (quicker)}`

`text(Actual mark)` `= mu + 2 xx sigma`
  `= 63 + 2 xx 8`
  `= 79`


`text(Method 2)`

`ztext(-score)` `= (x-mu)/sigma`
`2` `= (x-63)/8`
`16` `=x-63`
`x` `=79`

 
`=>D`

Filed Under: Normal Distribution, S5 The Normal Distribution (Y12), The Normal Distribution (Y12) Tagged With: Band 4, common-content, smc-6919-10-Single z-score, smc-819-10-Single z-score, smc-995-10-Single z-score

Statistics, STD2 S5 2020 HSC 35

The intelligence Quotient (IQ) scores for adults in City A are normally distributed with a mean of 108 and a standard deviation of 10.

The IQ score for adults in City B are normally distributed with a mean of 112 and a standard deviation of 16.

  1. Yin is an adult who lives in City A and has an IQ score of 128.
    What percentage of the adults in this city have an IQ score higher than Yin's?   (2 marks) 

    --- 4 WORK AREA LINES (style=lined) ---

  2. There are 1 000 000 adults living in City B.
    Calculate the number of adults in City B that would be expected to have an IQ score lower than Yin's.   (2 marks)

    --- 4 WORK AREA LINES (style=lined) ---

  3. Simon, an adult who lives in City A, moves to City B. The  `z` -score corresponding to his IQ score in City A is the same as the `z`-score corresponding to his IQ score in City B.
    By first forming an equation, calculate Simon's IQ score. Give your answer correct to one decimal place.   (3 marks)

    --- 6 WORK AREA LINES (style=lined) ---

Show Answers Only

a.    `text(2.5%)`

b.    `840 \ 000`

c.    `101.3`

Show Worked Solution

a.    `text{In City A:}`

♦ Mean mark (a) 50%.

`z text{-score}\ (128) = frac {x -mu}{sigma} = frac{128 – 108}{10} = 2`


`therefore\ text{2.5% have a higher IQ in City} \ A.`
 

b.    `text{In City B:}`

♦ Mean mark (b) 44%.

`z text{-score}\ (128) = frac{128-112}{16} = 1`


`therefore \ text{Adults in City} \ B \ text{with an IQ}\ <  128`

`= 84text(%) xx 1 \ 000 \ 000= 840 \ 000`
 

c.    `z text{-score in City A}\ = z text{-score in City B}`

♦♦♦ Mean mark (c) 17%.
`frac{x-108}{10} ` `= frac{x-112}{16} \ \ text{(multiply b.s.} \ xx 160 text{)}`
`16 (x-108)` `= 10 (x-112)`
`16 x-1728` `= 10 x-1120`
`6x` `= 608`
`x` `= 101.3`

  
`therefore \ text{Simon’s IQ} = 101.3 \ text{(to 1 d.p.)}`

Filed Under: S5 The Normal Distribution (Y12), The Normal Distribution (Y12) Tagged With: Band 5, Band 6, common-content, smc-6919-10-Single z-score, smc-6919-30-Comparisons of Data Sets, smc-819-10-Single z-score, smc-819-30-Comparisons of Data Sets

Statistics, 2ADV S3 2020 HSC 9 MC

Suppose the weight of melons is normally distributed with a mean of `mu` and a standard deviation of `sigma`.

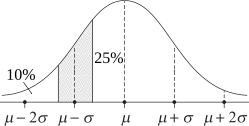
A melon has a weight below the lower quartile of the distribution but NOT in the bottom 10% of the distribution.

Which of the following most accurately represents the region in which the weight of this melon lies?
 

A. B.
C. D.
Show Answers Only

`C`

Show Worked Solution

`text(Distributions using)\ mu and sigma:`


`text(Adjusting the above to identify the interval  10% < weight < 25%)`

  
`=>C`

Filed Under: Normal Distribution, The Normal Distribution, The Normal Distribution (Y12) Tagged With: Band 4, common-content, smc-6919-20-z-score Intervals, smc-6919-40-Graphs, smc-7138-20-z-score Intervals, smc-7138-40-Graphs, smc-995-20-z-score Intervals, smc-995-40-Graphs

Statistics, STD2 S5 2020 HSC 8 MC

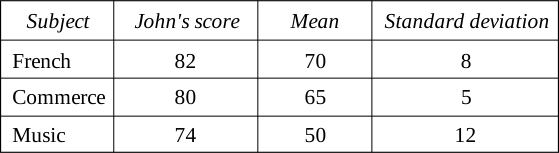
John recently did a class test in each of three subjects. The class scores on each test were normally distributed.

The table shows the subjects and John's scores as well as the mean and standard deviation of the class scores on each test.

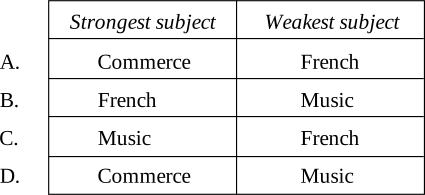
Relative to the rest of class, which row of the table below shows John's strongest subject and his weakest subject?

Show Answers Only

`A`

Show Worked Solution

`text(Calculate the)\ ztext(-score of each subject:)`

`ztext{-score (French)} = frac(82-70)(8) = 1.5`

`ztext{-score (Commerce)} = frac(80-65)(5) = 3.0`

`ztext{-score (Music)} = frac(74-50)(12) = 2.0`

 
`therefore \ text{Commerce is strongest, French is weakest}`

`=> \ A`

Filed Under: S5 The Normal Distribution (Y12), The Normal Distribution (Y12) Tagged With: 2adv-std2-common, Band 4, common-content, smc-6919-30-Comparisons of Data Sets, smc-819-30-Comparisons of Data Sets

Statistics, STD2 S5 2019 HSC 38

In a particular country, the birth weight of babies is normally distributed with a mean of 3000 grams. It is known that 95% of these babies have a birth weight between 1600 grams and 4400 grams.

One of these babies has a birth weight of 3497 grams. What is the `z`-score of this baby's birth weight?   (2 marks)

--- 6 WORK AREA LINES (style=lined) ---

Show Answers Only

`0.71`

Show Worked Solution

`text(95% babies within)\ 1600-4400\ \text{grams:}`

♦ Mean mark 44%.

`3000+2\sigma` `=4400`
`2sigma` `= 1400`
`sigma` `= 1400/2=700`

 
`:. ztext(-score)\ (3497)= (x-mu)/\sigma= (3497-3000)/700= 0.71`

Filed Under: Normal Distribution, S5 The Normal Distribution (Y12), The Normal Distribution (Y12) Tagged With: Band 5, common-content, smc-6919-10-Single z-score, smc-819-10-Single z-score, smc-995-10-Single z-score

Statistics, STD2 S5 2019 HSC 15 MC

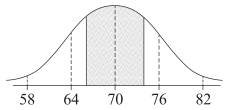
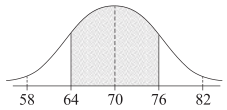
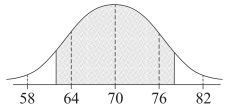
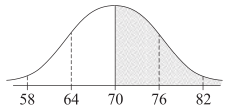
The scores on an examination are normally distributed with a mean of 70 and a standard deviation of 6. Michael received a score on the examination between the lower quartile and the upper quartile of the scores.

Which shaded region most accurately represents where Michael's score lies?
 

A.
 
B.
 
C. D.
Show Answers Only

`A`

Show Worked Solution

`text{68% of marks lie between 64 and 76 (mean ± 1 σ).}`

♦♦♦ Mean mark 17%.

`text(50% of marks lie between)\ Q_1\ text(and)\ Q_3.`

`=> A`

Filed Under: Normal Distribution, S5 The Normal Distribution (Y12), The Normal Distribution (Y12) Tagged With: Band 6, common-content, smc-6919-20-z-score Intervals, smc-6919-40-Graphs, smc-819-20-z-score Intervals, smc-819-40-Graphs, smc-995-20-z-score Intervals, smc-995-40-Graphs

Statistics, STD2 S5 EQ-Bank 21

The diastolic measurement for blood pressure in 30-year-old people is normally distributed, with a mean of 82 and standard deviation of 16.

  1. A person is considered to have low blood pressure if the diastolic measurement is 66 or less.


    What percentage of 30-year-old people have low blood pressure?   (1 mark)

    --- 2 WORK AREA LINES (style=lined) ---

  2. Calculate the `z`-score for a diastolic measurement of 70.   (1 mark)

    --- 2 WORK AREA LINES (style=lined) ---

Show Answers Only

a.    `16text(%)`

b.    `-0.75`

Show Worked Solution

a.    `ztext(-score)\ (66)= (66-82)/16=-1`
 

`:.\ text(Percentage)= 100-(50+34)= 16text(%)`
 

b.    `ztext(-score) (70)= (70-82)/16= -0.75`

Filed Under: S5 The Normal Distribution (Y12), The Normal Distribution (Y12) Tagged With: Band 4, common-content, smc-6919-10-Single z-score, smc-819-10-Single z-score

Statistics, STD2 S5 2018 HSC 27e

Joanna sits a Physics test and a Biology test.

  1. Joanna’s mark in the Physics test is 70. The mean mark for this test is 58 and the standard deviation is 8.


    Calculate the `z`-score for Joanna’s mark in this test.   (1 mark)

    --- 2 WORK AREA LINES (style=lined) ---

  2. In the Biology test, the mean mark is 64 and the standard deviation is 10.


    Joanna’s `z`-score is the same in both the Physics test and the Biology test.


    What is her mark in the Biology test?   (2 marks)

    --- 4 WORK AREA LINES (style=lined) ---

Show Answers Only

i.    `1.5`

ii.   `79`

Show Worked Solution

i.    `x = 70, \ mu = 58, \ sigma = 8`

`:. ztext(-score)` `= (x-mu)/sigma`
  `= (70-58)/8= 1.5`


ii.    `1.5` `= (x-64)/10`
  `x-64` `= 15`
  `:. x` `= 79`

Filed Under: Normal Distribution, S5 The Normal Distribution (Y12), The Normal Distribution (Y12) Tagged With: Band 3, Band 4, common-content, smc-6919-10-Single z-score, smc-6919-30-Comparisons of Data Sets, smc-819-10-Single z-score, smc-819-30-Comparisons of Data Sets, smc-995-10-Single z-score, smc-995-30-Comparisons of Data Sets

Statistics, STD2 S5 2018 HSC 23 MC

A set of data is normally distributed with a mean of 48 and a standard deviation of 3.

Approximately what percentage of the scores lies between 39 and 45?

  1. 15.85%
  2. 31.7%
  3. 47.5%
  4. 49.85%
Show Answers Only

`A`

Show Worked Solution

`text(Given)\ \ mu = 48, \ sigma = 3`

♦ Mean mark 47%.

`ztext{-score (39)}` `= (x-mu)/sigma`
  `= (39-48)/3`
  `=-3`


`ztext{-score (45)}` `= (45-48)/3`
  `=-1`


`:.\ text(Scores between 39 and 45)`

`~~ 16text(%)`

`=>A`

`text(Note that % of scores below 39 is very small.)`

Filed Under: Normal Distribution, S5 The Normal Distribution (Y12), The Normal Distribution (Y12) Tagged With: Band 5, common-content, smc-6919-20-z-score Intervals, smc-819-20-z-score Intervals, smc-995-20-z-score Intervals

Statistics, STD2 S5 2017 HSC 29d

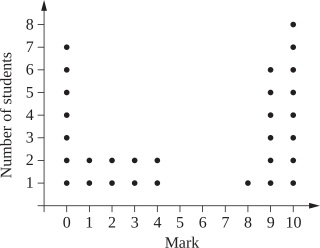
All the students in a class of 30 did a test.

The marks, out of 10, are shown in the dot plot.
 

  1. Find the median test mark.   (1 mark)

    --- 1 WORK AREA LINES (style=lined) ---

  2. The mean test mark is 5.4. The standard deviation of the test marks is 4.22.
  3. Using the dot plot, calculate the percentage of the marks which lie within one standard deviation of the mean.   (2 marks)

    --- 4 WORK AREA LINES (style=lined) ---

  4. A student states that for any data set, 68% of the scores should lie within one standard deviation of the mean. With reference to the dot plot, explain why the student’s statement is NOT relevant in this context.   (1 mark)

    --- 2 WORK AREA LINES (style=lined) ---

Show Answers Only

i.    `6`

ii.   `text(43%)`

iii.  `text(The statement assumes the data is normally distributed which is incorrect.)`

Show Worked Solution
♦ Mean mark (i) 50%.
♦♦ Mean mark (ii) 34%.

i.    `text(Median)= text(15th + 16th score)/2= (4 + 8)/2= 6`
 

ii.   `text(Lower limit) = 5.4-4.22 = 1.18`

`text(Upper limit) = 5.4 + 4.22 = 9.62`

`:.\ text(Percentage in between)`

`= 13/30 xx 100`

`= 43.33…`

`= 43text{%  (nearest %)}`


iii.  `text(The statement assumes the data is normally distributed.)`

♦♦♦ Mean mark (iii) 13%.

`text(This is incorrect in this case.)`

Filed Under: DS5/6 - Normal Distribution and Sampling, Normal Distribution, S5 The Normal Distribution (Y12), The Normal Distribution (Y12) Tagged With: Band 3, Band 5, Band 6, common-content, smc-6919-20-z-score Intervals, smc-6919-30-Comparisons of Data Sets, smc-819-20-z-score Intervals, smc-819-30-Comparisons of Data Sets, smc-995-20-z-score Intervals, smc-995-30-Comparisons of Data Sets

Statistics, STD2 S5 2017 HSC 13 MC

The heights of Year 12 girls are normally distributed with a mean of 165 cm and a standard deviation of 5.5 cm.

What is the `z`-score for a height of 154 cm?

  1. `-2`
  2. `-0.5`
  3. `0.5`
  4. `2`
Show Answers Only

`A`

Show Worked Solution
`ztext(-score)` `= (x-mu)/sigma`
  `= (154-165)/5.5=-2`

 
`=>A`

Filed Under: DS5/6 - Normal Distribution and Sampling, Normal Distribution, S5 The Normal Distribution (Y12), The Normal Distribution (Y12) Tagged With: Band 3, common-content, smc-6919-10-Single z-score, smc-819-10-Single z-score, smc-995-10-Single z-score

Statistics, STD2 S5 2016 HSC 30d

The formula to calculate `z`-scores can be rearranged to give

`mu = x-\sigma z`


where    `mu` is the mean
  `x` is the score
  `sigma` is the standard deviation
  `z` is the `z`-score
  1. In an examination, Aaron achieved a score of 88, which corresponds to a `z`-score of 2.4.
  2. Substitute these values into the rearranged formula above to form an equation.   (1 mark)

    --- 1 WORK AREA LINES (style=lined) ---

  3. In the same examination, Brock achieved a score of 52, which corresponds to a `z`-score of  –1.2.
  4. Using this information, form another equation and solve it simultaneously with the equation from part (a) to find the values of `mu` and `\sigma`.   (3 marks)

    --- 6 WORK AREA LINES (style=lined) ---

Show Answers Only

a.    `mu = 88-2.4\sigma`

b.    `64`

Show Worked Solution

a.    `mu = 88-2.4\sigma`
 

b.    `mu = 52 + 1.2\sigma\ …\ (1)`

♦♦ Mean mark (b) 32%.
COMMENT: This is primarily a simultaneous equation problem requiring normal distribution knowledge.

`mu = 88-2.4\sigma \ …\ (2)`
 

`text(Subtract)\ \ (2)-(1):`

`0= 36-3.6\sigma\ \ =>\ \ \sigma= 10`

 
`text(Substitute)\ \ \sigma = 10\ \ text(into)\ (1):`

`mu= 52 + 1.2 xx 10= 64`

Filed Under: DS5/6 - Normal Distribution and Sampling, Normal Distribution, The Normal Distribution (Y12) Tagged With: Band 4, Band 5, smc-6919-60-X-topic, smc-995-10-Single z-score

Statistics, STD2 S5 2016 HSC 13 MC

The speed limit outside a school is 40 km/h. Year 11 students measured the speed of passing vehicles over a period of time. They found the set of data to be normally distributed with a mean speed of 36 km/h and a standard deviation of 2 km/h.

What percentage of the vehicles passed the school at a speed greater than 40 km/h?

  1. `text(2.5%)`
  2. `text(5%)`
  3. `text(47.5%)`
  4. `text(95%)`
Show Answers Only

`A`

Show Worked Solution
`z` `= (x-mu)/sigma`
  `= (40-36)/2`
  `= 2`

2ug-2016-hsc-13-mc-answer

`=> A`

Filed Under: DS5/6 - Normal Distribution and Sampling, Normal Distribution, S5 The Normal Distribution (Y12), The Normal Distribution (Y12) Tagged With: Band 4, common-content, smc-6919-10-Single z-score, smc-819-10-Single z-score, smc-995-10-Single z-score

Statistics, STD2 S5 EQ-Bank 12 MC

The pulse rates of a large group of 18-year-old students are approximately normally distributed with a mean of 75 beats/minute and a standard deviation of 11 beats/minute. 

The percentage of 18-year-old students with pulse rates less than 53 beats/minute or greater than 86 beats/minute is closest to

  1. `2.5text(%)` 
  2. `5text(%)` 
  3. `16text(%)` 
  4. `18.5text(%)` 
Show Answers Only

`D`

Show Worked Solution

`mu=75,\ \ \ sigma=11`

COMMENT: Two applications of the 68-95-99.7% rule are required. A good strategy is to first draw a normal curve and shade the required areas.

`z text{-score (53)}=(x-mu) /sigma=(53-75)/11= -2`

`z text{-score (86)}= (86-75)/11=1`

core 2008 VCAA 6-7

`text(From the diagram, the % of students that have a)`

`z text(-score below –2 or above 1)`

 `=2.5+16=18.5 text(%)`

 `=>D`

Filed Under: DS5/6 - Normal Distribution and Sampling, Normal Distribution, S5 The Normal Distribution (Y12), The Normal Distribution (Y12) Tagged With: Band 5, common-content, smc-6919-20-z-score Intervals, smc-819-20-z-score Intervals, smc-995-20-z-score Intervals

Statistics, STD2 S5 EQ-Bank 6 MC

The head circumference (in cm) of a population of infant boys is normally distributed with a mean of 49.5 cm and a standard deviation of 1.5 cm.

Four hundred of these boys are selected at random and each boy’s head circumference is measured.

The number of these boys with a head circumference of less than 48.0 cm is closest to 

  1. `3`
  2. `10`
  3. `64`
  4. `272`
Show Answers Only

`C`

Show Worked Solution

`mu=49.5,\ \ sigma=1.5`

`z text{-score (49.5)` `=(x-mu)/sigma`
  `=(48.0-49.5)/1.5`
  `=-1`


`:.\ text(Number of boys with a head under 48.0 cm)`

`=16text(%) xx 400`

`=64`

`=>  C`

Filed Under: DS5/6 - Normal Distribution and Sampling, Normal Distribution, S5 The Normal Distribution (Y12), The Normal Distribution (Y12) Tagged With: Band 4, common-content, smc-6919-10-Single z-score, smc-819-10-Single z-score, smc-995-10-Single z-score

Statistics, STD2 S5 2015 HSC 28b

The results of two tests are normally distributed. The mean and standard deviation for each test are displayed in the table.

\begin{array} {|l|c|c|}
\hline
\rule{0pt}{2.5ex}  \rule[-1ex]{0pt}{0pt} & \text{Mathematics} & \quad \text{English} \quad \\
\hline
\rule{0pt}{2.5ex} \quad \mu \quad \rule[-1ex]{0pt}{0pt} & 70 & 75 \\
\hline
\rule{0pt}{2.5ex} \quad \sigma \rule[-1ex]{0pt}{0pt} & 6.5 & 8 \\
\hline
\end{array}

Kristoff scored 74 in Mathematics and 80 in English. He claims that he has performed better in English.

Is Kristoff correct? Justify your answer using appropriate calculations.   (2 marks)

--- 4 WORK AREA LINES (style=lined) ---

Show Answers Only

`text(He is correct.)`

Show Worked Solution

`text(In Maths:)`

♦ Mean mark 44%.

`ztext{-score (74)}= (x-mu)/sigma= (74-70)/6.5= 0.6153…`

`text(In English:)`

`ztext{-score (80)}=(80-75)/8= 0.625`
 

`text(Kristoff’s)\ ztext(-score in English is higher than his)\ z text(-score in Maths.)`

`:.\ text(He is correct. He performed better in English.)`

Filed Under: DS5/6 - Normal Distribution and Sampling, Normal Distribution, S5 The Normal Distribution (Y12), The Normal Distribution (Y12) Tagged With: Band 5, common-content, smc-6919-10-Single z-score, smc-6919-30-Comparisons of Data Sets, smc-819-10-Single z-score, smc-819-30-Comparisons of Data Sets, smc-995-10-Single z-score, smc-995-30-Comparisons of Data Sets

Statistics, STD2 S5 2015 HSC 20 MC

A machine produces cylindrical pipes. The mean of the diameters of the pipes is 8 cm and the standard deviation is 0.04 cm.

Assuming a normal distribution, what percentage of cylindrical pipes produced will have a diameter less than 7.96 cm?

  1. `text(16%)`
  2. `text(32%)`
  3. `text(34%)`
  4. `text(68%)`
Show Answers Only

`A`

Show Worked Solution

`mu = 8\ text(cm)\ \ \ s = 0.04\ text(cm)`

♦ Mean mark 50%.

`ztext{-score(7.96)}= (x-mu)/sigma= (7.96-8)/0.04=-1`
 

2UG 2015 20MC Answer

`:.\ text(% of pipes with a diameter less than 7.96 cm.)`

`=\ text(50%)-text(34%)`

`=\ text(16%)`

`=>A`

Filed Under: DS5/6 - Normal Distribution and Sampling, Normal Distribution, S5 The Normal Distribution (Y12), The Normal Distribution (Y12) Tagged With: Band 5, common-content, smc-6919-10-Single z-score, smc-819-10-Single z-score, smc-995-10-Single z-score

Statistics, STD2 S5 2005 HSC 26c

The weights of boxes of Brekky Bicks are normally distributed. The mean is 754 grams and the standard deviation is 2 grams.

  1. What is the `z`-score of a box of Brekky Bicks with a weight of 754 g?   (1 mark)

    --- 2 WORK AREA LINES (style=lined) ---

  2. What is the weight of a box that has a `z`-score of  –1?   (1 mark)

    --- 2 WORK AREA LINES (style=lined) ---

  3. Brekky Bicks boxes are labelled as having a weight of 750 g. What percentage of boxes will have a weight less than 750 g?   (2 marks)

    --- 4 WORK AREA LINES (style=lined) ---

Show Answers Only

a.    `0\ text{(mean)}`

b.    `752\ text(grams)`

c.    `text(2.5%)`

Show Worked Solution

a.    `text{z-score (754 g) = 0  (754 g is the mean)}`


b.    `ztext(-score)` `= (x-mu)/sigma`
`-1` `= (x-754)/2`
 `x-754` `= -2`
`x`  `= 752\ text(grams)`

 
c.
    `text{z-score (750)= (750-754)/2= -2`


`:.\ text(Graph shows that 2.5% of boxes will weigh less than 750 g.)`

Filed Under: DS5/6 - Normal Distribution and Sampling, Normal Distribution, S5 The Normal Distribution (Y12), The Normal Distribution (Y12) Tagged With: Band 4, Band 5, common-content, smc-6919-10-Single z-score, smc-819-10-Single z-score, smc-995-10-Single z-score

Statistics, STD2 S5 2004 HSC 24c

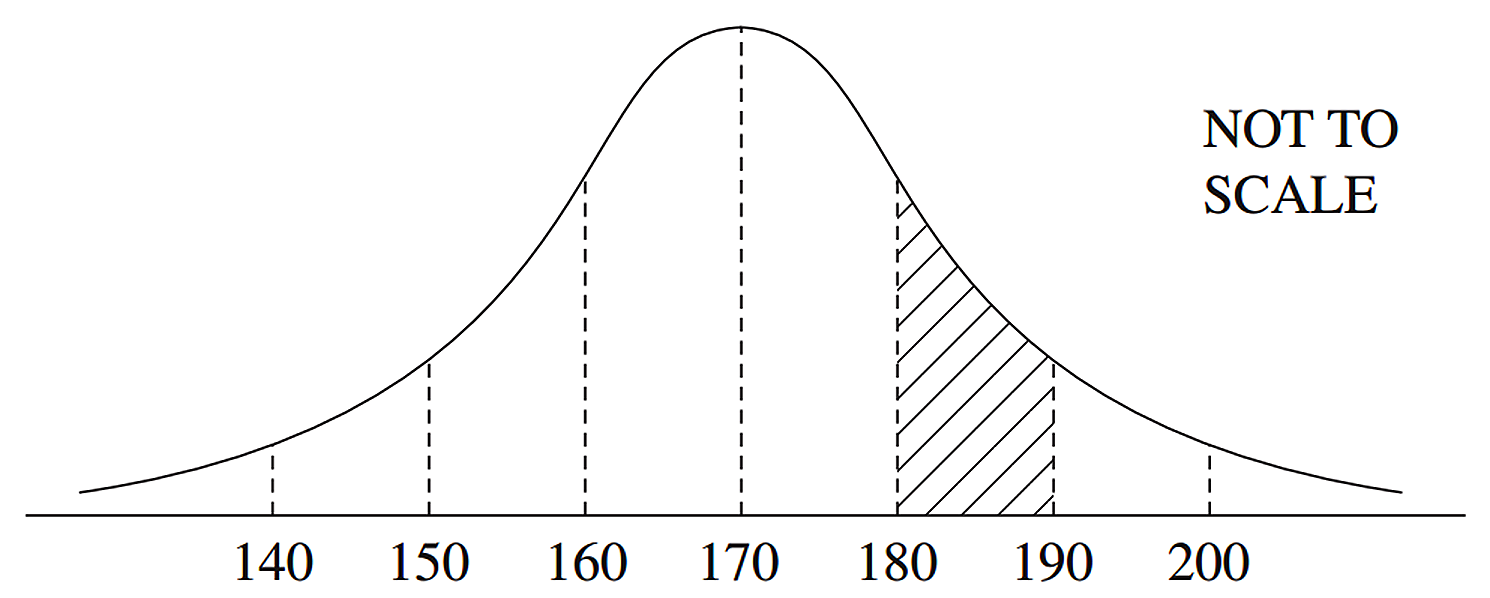
The normal distribution shown has a mean of 170 and a standard deviation of 10.
 

  1. Roberto has a raw score in the shaded region. What could his `z`-score be?   (1 mark)

    --- 1 WORK AREA LINES (style=lined) ---

  2. What percentage of the data lies in the shaded region?   (2 marks)

    --- 4 WORK AREA LINES (style=lined) ---

Show Answers Only

a.    `1 <= text(z-score) <= 2`

b.    `text(13.5%)`

Show Worked Solution

a.    `ztext{-score(180)}= (x-mu)/sigma= (180-170)/10= 1`

`ztext{-score(190)}= (190-170)/10= 2`

 `:. 1 <= ztext(-score) <= 2`


b.    

`text(From the graph above:)`

`text(13.5% lies in the shaded area.)`

Filed Under: DS5/6 - Normal Distribution and Sampling, Normal Distribution, S5 The Normal Distribution (Y12), The Normal Distribution (Y12) Tagged With: Band 4, Band 5, common-content, smc-6919-20-z-score Intervals, smc-6919-40-Graphs, smc-819-20-z-score Intervals, smc-819-40-Graphs, smc-995-20-z-score Intervals, smc-995-40-Graphs

Statistics, STD2 S5 2006 HSC 17 MC

In a normally distributed set of scores, the mean is 23 and the standard deviation is 5.

Approximately what percentage of the scores will lie between 18 and 33?

  1. `text(34%)`
  2. `text(47.5%)`
  3. `text(68%)`
  4. `text(81.5%)`
Show Answers Only

`D`

Show Worked Solution

`mu = 23`

`sigma = 5`

`z text{-score (18)}` `= (x-mu)/sigma`
  `= (18-23)/5=-1`
`z text{-score (33)}` `= (33-23)/5= 2`

z-score

`:.\ text(Percentage between –1 and 2)`

`= 34 + 34 + 13.5=\ text(81.5%)`

`=>  D`

Filed Under: DS5/6 - Normal Distribution and Sampling, Normal Distribution, S5 The Normal Distribution (Y12), The Normal Distribution (Y12) Tagged With: Band 5, common-content, smc-6919-20-z-score Intervals, smc-819-20-z-score Intervals, smc-995-20-z-score Intervals

Statistics, STD2 S1 2006 HSC 8 MC

Which of these graphs best represents positively skewed data with the smaller standard deviation?
 

2UG-2006-8abMC

2UG-2006-8cdMC

Show Answers Only

`C`

Show Worked Solution

`text(By elimination:)`

`text(Positive skew when the tail on the right side is longer.)`

`:.\ text(NOT)\ B\ text(or)\ D`

`text(A smaller standard deviation occurs when data is clustered more closely.)`

`:.\ text(NOT)\ A\ text(where data is more widely spread.)`

`=>  C`

Filed Under: Bar Charts, Histograms and Other Graphs, Displaying Data - Other Charts, Displaying Data - Other Charts, DS5/6 - Normal Distribution and Sampling, Normal Distribution, Other Chart Types, Other Charts, Other Graphs, S5 The Normal Distribution (Y12), The Normal Distribution (Y12) Tagged With: Band 5, common-content, smc-1128-28-Other Charts, smc-6311-30-Other Charts, smc-6531-30-Other Charts, smc-819-40-Graphs, smc-822-40-Other Charts, smc-995-40-Graphs, smc-998-40-Other Charts

Statistics, STD2 S5 EQ-Bank 5 MC

The length of a type of ant is approximately normally distributed with a mean of 4.8 mm and a standard deviation of `1.2` mm.

A standardised ant length of  `z = -0.5`  corresponds to an actual ant length of

  1. ` text(2.4 mm)`
  2. `text(3.6 mm)`
  3. `text(4.2 mm)`
  4. `text(5.4 mm)`
Show Answers Only

`C`

Show Worked Solution
`z` `=(x-mu)/sigma`
`-0.5` `=(x-4.8)/1.2`
`-0.6` `=x-4.8`
`x` `=4.2\ text(mm)`

 
`=>C`


Filed Under: DS5/6 - Normal Distribution and Sampling, Normal Distribution, S5 The Normal Distribution (Y12), The Normal Distribution (Y12) Tagged With: Band 4, common-content, smc-6919-10-Single z-score, smc-819-10-Single z-score, smc-995-10-Single z-score

Statistics, STD2 S5 EQ-Bank 11 MC

The time, in hours, that each student spent sleeping on a school night was recorded for 1550 secondary-school students. The distribution of these times was found to be approximately normal with a mean of 7.4 hours and a standard deviation of 0.7 hours.

How many students would you expect to spend more than 8.1 hours sleeping on a school night?

You may assume for normally distributed data that:

    • 68% of scores have  `z`-scores between  `-1` and `1`
    • 95% of scores have  `z`-scores between  `-2` and `2`
    • 99.7% of scores have  `z`-scores between  `-3` and `3`.
  1. `16`
  2. `248`
  3. `1302`
  4. `1510`
Show Answers Only

`B`

Show Worked Solution

`text (Need to find z-score of 8.1 hours)`

`text(z-score)= (x-mu)/sigma= (8.1-7.4)/0.7= 1`

`text(68% students with  –1 < z-score < 1)`

`:.\ text(16% have  z-score > 1)`

`text(# Students)= 16%×1550= 248`

`=>B`

Filed Under: DS5/6 - Normal Distribution and Sampling, Normal Distribution, S5 The Normal Distribution (Y12), The Normal Distribution (Y12) Tagged With: Band 5, common-content, smc-6919-10-Single z-score, smc-819-10-Single z-score, smc-995-10-Single z-score

Algebra, STD2 A2 2007 HSC 27b

A clubhouse uses four long-life light globes for five hours every night of the year. The purchase price of each light globe is $6.00 and they each cost `$d` per hour to run.

  1. Write an equation for the total cost (`$c`) of purchasing and running these four light globes for one year in terms of `d`.   (2 marks)

    --- 4 WORK AREA LINES (style=lined) ---

  2. Find the value of `d` (correct to three decimal places) if the total cost of running these four light globes for one year is $250.   (1 mark)

    --- 2 WORK AREA LINES (style=lined) ---

  3. If the use of the light globes increases to ten hours per night every night of the year, does the total cost double? Justify your answer with appropriate calculations.   (1 mark)

    --- 2 WORK AREA LINES (style=lined) ---

  4. The manufacturer’s specifications state that the expected life of the light globes is normally distributed with a standard deviation of 170 hours.


    What is the mean life, in hours, of these light globes if 97.5% will last up to 5000 hours?   (1 mark)

    --- 2 WORK AREA LINES (style=lined) ---

Show Answers Only

a.    `$c = 24 + 7300d`

b.    `0.031\ $ text(/hr)\ text{(3 d.p.)}`

c.    `text(Proof)\ \ text{(See Worked Solutions)}`

d.    `text(4660 hours.)`

Show Worked Solution

a.   `text(Purchase price) = 4 xx 6 = $24`

`text(Running cost)` `= text(# Hours) xx text(Cost per hour)`
  `= 4 xx 5 xx 365 xx d= 7300d`

 
`:.\ $c = 24 + 7300d`
 

b.    `text(Given)\ \ $c = $250:`

`250` `= 24 + 7300d`
`7300d` `= 226`
`d` `= 226/7300= 0.03095…= 0.031\ $ text(/hr)\ text{(3 d.p.)}`


c.    `text(If)\ d\ text(doubles to 0.062)\ \ $text(/hr)`

`$c= 24 + 7300 xx 0.062= $476.60`

`text(S) text(ince $476.60 is less than)\ 2 xx $250\ ($500),`

`text(the total cost increases to less than double)`

`text(the original cost.)`
 

d.    `sigma = 170`

`z\ text(-score of 5000 hours) = 2`

`z` `= (x-mu)/sigma`
`2` `= (5000-mu)/170`
`340` `= 5000-mu`
`mu` `= 4660`


`:.\ text(The mean life of these globes is 4660 hours.)`

Filed Under: Applications of Linear Relationships, Applications: Currency, Fuel and Other Problems, Breakeven and Financial modelling, DS5/6 - Normal Distribution and Sampling, Linear Functions, Linear Functions, Normal Distribution, S5 The Normal Distribution (Y12), The Normal Distribution (Y12) Tagged With: Band 4, Band 5, common-content, smc-6214-55-Cost/Revenue, smc-6256-30-Other Linear Applications, smc-6919-10-Single z-score, smc-793-30-Other Linear Applications, smc-819-10-Single z-score, smc-985-10-Cost/Revenue, smc-995-10-Single z-score

Statistics, STD2 S5 2007 HSC 25d

The results of two class tests are normally distributed. The means and standard deviations of the tests are displayed in the table.

\begin{array} {|l|c|c|}
\hline
\rule{0pt}{2.5ex}  \rule[-1ex]{0pt}{0pt} & \quad \text{Test 1} \quad & \quad \text{Test 2} \quad \\
\hline
\rule{0pt}{2.5ex} \text{Mean} \rule[-1ex]{0pt}{0pt} & 60 & 58 \\
\hline
\rule{0pt}{2.5ex} \text{Standard Deviation} \rule[-1ex]{0pt}{0pt} & 6.2 & 6.0 \\
\hline
\end{array}

  1. Stuart scored 63 in Test 1 and 62 in Test 2. He thinks that he has performed better in Test 1. Do you agree? Justify your answer using appropriate calculations.   (2 marks)

    --- 5 WORK AREA LINES (style=lined) ---

  2. If 150 students sat for Test 2, how many students would you expect to have scored less than 64?   (2 marks)

    --- 4 WORK AREA LINES (style=lined) ---

Show Answers Only

a.    `text(Proof)\ \ text{(See Worked Solutions)}`

b.    `126`

Show Worked Solution

a.    `text(In Test 1:)\ \ mu = 60,\ sigma = 6.2`

`z text(-score)\ (63)= (x-mu)/sigma= (63-60)/6.2= 0.483…`

 
`text(In Test 2:)\ \ mu = 58,\ sigma = 6.0`

`z text(-score)\ (62)= (62-58)/6.0=0.666…`

`text(S) text(ince Stuart’s)\ z\ text(-score is higher in Test 2, his performance relative)`

`text(to the class is better despite his mark being slightly lower.)`
 

b.    `text(In Test 2:)`

`z text(-score)\ (64)= (64-58)/6= 1`

`text(84% have)\ z text(-score) < 1`

`:.\ text(# Students expected below 64) = text(84%) xx 150 = 126`

Filed Under: DS5/6 - Normal Distribution and Sampling, Normal Distribution, S5 The Normal Distribution (Y12), The Normal Distribution (Y12) Tagged With: Band 4, Band 5, common-content, smc-6919-10-Single z-score, smc-6919-30-Comparisons of Data Sets, smc-819-10-Single z-score, smc-819-30-Comparisons of Data Sets, smc-995-10-Single z-score, smc-995-30-Comparisons of Data Sets

Statistics, STD2 S5 2014 HSC 24 MC

The weights of  10 000 newborn babies in NSW are normally distributed. These weights have a mean of 3.1 kg and a standard deviation of 0.35 kg.

How many of these newborn babies have a weight between 2.75 kg and 4.15 kg?

  1. `4985`
  2. `6570`
  3. `8370`
  4. `8385`
Show Answers Only

`D`

Show Worked Solution
♦ Mean mark 46%

`text(Find)\ z text(-scores of 2.75 and 4.15 kg)`

`z\ (2.75)` `= (x-mu)/5 = (2.75-3.1)/0.35 = -1`
`z\ (4.15)` `= (4.15-3.1)/0.35 = 3`

 
`text(68% between)\ z=–1\ text(and 1)\ => \ text(34% between)\ z=–1\ text(and 0)`

`text(99.7% between)\ z=–3\ text(and 3) \ => \ text(49.85% between)\ z=0\ text(and)\ 3`
 

`%\ text(with)\ z text(-scores between)\ –1\ text(and 3) = 34 + 49.85 =\ text(83.85%)`

`text(Babies between 2.75 kg and 4.15 kg) = text(83.85%) xx 10\ 000 = 8385`

`=>  D`

Filed Under: DS5/6 - Normal Distribution and Sampling, Normal Distribution, S5 The Normal Distribution (Y12), The Normal Distribution (Y12) Tagged With: Band 5, common-content, smc-6919-20-z-score Intervals, smc-819-20-z-score Intervals, smc-995-20-z-score Intervals

Statistics, STD2 S5 2011 HSC 27c

Two brands of light bulbs are being compared. For each brand, the life of the light bulbs, in hours, is normally distributed and described in the table below.

\begin{array} {|l|c|c|}
\hline
\rule{0pt}{2.5ex}  \rule[-1ex]{0pt}{0pt} & \quad \text{Mean} \quad & \text{Standard Deviation} \\
\hline
\rule{0pt}{2.5ex} \text{Brand A} \rule[-1ex]{0pt}{0pt} & 450 & 25 \\
\hline
\rule{0pt}{2.5ex} \text{Brand B} \rule[-1ex]{0pt}{0pt} & 500 & 50 \\
\hline
\end{array}

  1. One of the Brand B light bulbs has a life of 400 hours. 
  2. What is the `z`-score of the life of this light bulb?   (1 mark)

    --- 1 WORK AREA LINES (style=lined) ---

  3. A light bulb is considered defective if it lasts less than 400 hours. The following claim is made:
  4. ‘Brand A light bulbs are more likely to be defective than Brand B light bulbs.’
  5. Is this claim correct? Justify your answer, with reference to `z`-scores or standard deviations or the normal distribution.   (2 marks)

    --- 4 WORK AREA LINES (style=lined) ---

Show Answers Only

a.    `-2`

b.    `text(The claim is incorrect.)`

Show Worked Solution

a.    `z text{-score of Brand B bulb (400 hrs)}`

`= (x-mu)/sigma= (400-500)/50= -2`
 

b.    `z text{-score of Brand A bulb (400 hours)}`

♦ Mean mark (b) 42%

`=(400-450)/25=-2`
 

`text(S)text(ince the)\ z text(-score for both brands is –2, they are equally likely to be defective.)`

`:.\ text(The claim is incorrect.)`

Filed Under: DS5/6 - Normal Distribution and Sampling, Normal Distribution, S5 The Normal Distribution (Y12), The Normal Distribution (Y12) Tagged With: Band 4, Band 5, common-content, smc-6919-10-Single z-score, smc-6919-30-Comparisons of Data Sets, smc-819-10-Single z-score, smc-819-30-Comparisons of Data Sets, smc-995-10-Single z-score, smc-995-30-Comparisons of Data Sets

Statistics, STD2 S5 2009 HSC 25d

In Broken Hill, the maximum temperature for each day has been recorded. The mean of these maximum temperatures during spring is 25.8°C, and their standard deviation is 4.2° C. 

  1. What temperature has a `z`-score of  –1?   (1 mark)

    --- 3 WORK AREA LINES (style=lined) ---

  2. What percentage of spring days in Broken Hill would have maximum temperatures between 21.6° C and 38.4°C?


    You may assume that these maximum temperatures are normally distributed and that

  3.  

    • 68% of maximum temperatures have `z`-scores between –1 and 1
    • 95% of maximum temperatures have `z`-scores between –2 and 2
    • 99.7% of maximum temperatures have `z`-scores between –3 and 3.   (3 marks)

    --- 6 WORK AREA LINES (style=lined) ---

Show Answers Only

a.    `21.6^@`

b.    `text(83.85%)`

Show Worked Solution

a.    `mu = 25.8\ \ \ sigma = 4.2`

`text(Using)\ \ \ \ z` `= (x-mu)/sigma`
`-1` `= (x-25.8)/4.2`
`x-25.8` `= -4.2`
`x` `= 21.6°`


`:.\ 21.6^@\ text(has a)\ z text(-score of)  -1` 

  
b.   
`z text(-score of)\ 21.6 =-1`

♦ Mean mark (b) 41%
MARKER’S COMMENT: Many students failed to use the answer to (d)(i), costing them valuable exam time.

`text(Find)\ z text(-score of 38.4)`

`z\ (38.4)` `= (38.4-25.8)/4.2=3`


`text(68% of scores are between)\ z=-1\ text(and 1)`

`=>\ text(34%)\ text(are between)\ z=-1\ text(and 0)`

`text(99.7% of scores are between)\ z=-3\ text(and 3)`

`=>\ text(49.85%)\ text(are between)\ z=0\ text(and 3)`
  

`:.\ text(% Temps between 21.6° and 38.4°)`

`=\ text(34% + 49.85%)=\ text(83.85%)`

Filed Under: DS5/6 - Normal Distribution and Sampling, Normal Distribution, S5 The Normal Distribution (Y12), The Normal Distribution (Y12) Tagged With: Band 4, Band 5, common-content, smc-6919-10-Single z-score, smc-6919-20-z-score Intervals, smc-819-10-Single z-score, smc-819-20-z-score Intervals, smc-995-10-Single z-score, smc-995-20-z-score Intervals

Statistics, STD2 S5 2013 HSC 29b

Ali’s class sits two Geography tests. The results of her class on the first Geography test are shown.

`58,\ \ 74,\ \ 65,\ \ 66,\ \ 73,\ \ 71,\ \ 72,\ \ 74,\ \ 62,\ \ 70`

The mean was 68.5 for the first test. 

  1. Calculate the standard deviation for the first test. Give your answer correct to one decimal place.   (1 mark)

    --- 1 WORK AREA LINES (style=lined) ---

  2. On the second Geography test, the mean for the class was 74.4 and the standard deviation was 12.4.


    Ali scored 62 on the first test. Calculate the mark that she needed to obtain in the second test to ensure that her performance relative to the class was maintained.   (3 marks)

    --- 6 WORK AREA LINES (style=lined) ---

Show Answers Only

a.    `5.2\ \ \ text{(to 1 d.p.)}`

b.    `text(Ali needs to score 58.9)`

Show Worked Solution
♦ Mean mark (a) 39%
COMMENT: Make sure you are confident with this function on your calculator!

a.    `sigma=5.2201…=5.2\ text{(to 1 d.p.)}`

b.    `z =(x-mu)/sigma`

`z text{-score (1st test)}` `= (62-68.5)/5.2`
  `=-1.25`

 
`text(2nd test has)\ z text(-score of)\ \-1.25 :`

♦♦ Mean mark (b) 21%.
MARKER’S COMMENT: When “performance relative to the class is maintained”, `z text(-scores)` are the same in each test.
`-1.25` `= (x-74.4)/12.4`
`x-74.4` `=-15.5`
`x` `=58.9`

  
`:.\ text(Ali needs to score 58.9)`

Filed Under: DS5/6 - Normal Distribution and Sampling, Measures of Centre and Spread, Normal Distribution, S5 The Normal Distribution (Y12), Summary Statistics - No Graph, The Normal Distribution (Y12) Tagged With: Band 5, common-content, smc-6312-50-Std Dev (by Calc), smc-6919-10-Single z-score, smc-6919-30-Comparisons of Data Sets, smc-819-10-Single z-score, smc-819-30-Comparisons of Data Sets, smc-824-50-Std Dev (by calc), smc-995-10-Single z-score, smc-995-30-Comparisons of Data Sets

Statistics, STD2 S5 2010 HSC 24c

The marks in a class test are normally distributed. The mean is 100 and the standard deviation is 10.

  1. Jason's mark is 115. What is his  `z`-score?   (1 mark)

    --- 2 WORK AREA LINES (style=lined) ---

  2. Mary has a `z`-score of 0. What mark did she achieve in the test?   (1 mark)

    --- 1 WORK AREA LINES (style=lined) ---

  3. What percentage of marks lie between 80 and 110?


    You may assume the following:


    • 68% of marks have a `z`-score between –1 and 1


    • 95% of marks have a `z`-score between  –2 and 2


    • 99.7% of marks have a `z`-score between –3 and 3.   (2 marks) 

    --- 4 WORK AREA LINES (style=lined) ---

Show Answers Only

a.    `1.5`

b.    `100`

c.    `81.5%`

Show Worked Solution

a.    ` text(Given) \ \ mu=100,\ \ sigma=10`

MARKER’S COMMENT: Too may students had calculator errors in this question, giving away easy marks. BE CAREFUL!

`text(If mark is 115,)`

`ztext(-score)` `=(115-mu)/sigma`
  `=(115-100)/100=1.5`

  
b.
    `z text(-score = 0 when mark equals the mean)`

`:.\ text(Mary’s score was)\ 100`


♦ Mean mark 42%
c.    `ztext(-score of)\ 110` `=(110-100)/10=1`
`ztext(-score of)\ 80` `=(80-100)/10=–2`

  
`text(68% of marks lie between)\ z=-1 \ text(and)\  1`

 `=>text(34%  lie between)\ z= 0\ text(and)\ 1`

`text(95%  of marks lie between)\ z=-2 \ text(and)\  2`

 `=> text(47.5%  lie between)\ z=-2\ text(and)\ 0`


`:.\ text(% marks between 80 and 110`

`=\ text(34% + 47.5%)=\ text(81.5%)`

Filed Under: DS5/6 - Normal Distribution and Sampling, Normal Distribution, S5 The Normal Distribution (Y12), The Normal Distribution (Y12) Tagged With: Band 4, Band 5, common-content, smc-6919-10-Single z-score, smc-6919-20-z-score Intervals, smc-819-10-Single z-score, smc-819-20-z-score Intervals, smc-995-10-Single z-score, smc-995-20-z-score Intervals

Statistics, STD2 S5 2012 HSC 29b

A machine produces nails. When the machine is set correctly, the lengths of the nails are normally distributed with a mean of  6.000 cm  and a standard deviation of  0.040 cm.

To confirm the setting of the machine, three nails are randomly selected. In one sample the lengths are  5.950,  5.983 and  6.140.

The setting of the machine needs to be checked when the lengths of two or more nails in a sample lie more than 1 standard deviation from the mean.

Does the setting on the machine need to be checked? Justify your answer with suitable calculations.   (2 marks)

--- 6 WORK AREA LINES (style=lined) ---

Show Answers Only

`mu = 6.000,\ \sigma = 0.040`

`text{Limits for}\ ±1 \sigma:`

`6.000 + 0.040 = 6.040\ text{(upper)}`

`6.000-0.040 = 5.960\ text{(lower)}`

`text(Chosen nails:)\ \ 5.950` `=>\ text(outside limits)`
`5.983` `=>\ text(inside)`
`6.140` `=>\ text(outside)`


`text{Since 2 nails are outside 1}\ \sigma\ \text{limits}`

`=>\ \ \text{Settings need to be checked.}`

Show Worked Solution
♦ Mean mark 44%

`mu = 6.000,\ \sigma = 0.040`

`text{Limits for}\ ±1 \sigma:`

`6.000 + 0.040 = 6.040\ text{(upper)}`

`6.000-0.040 = 5.960\ text{(lower)}`

`text(Chosen nails:)\ \ 5.950` `=>\ text(outside limits)`
`5.983` `=>\ text(inside)`
`6.140` `=>\ text(outside)`


`text{Since 2 nails are outside 1}\ \sigma\ \text{limits}`

`=>\ \ \text{Settings need to be checked.}`

Filed Under: DS5/6 - Normal Distribution and Sampling, Normal Distribution, S5 The Normal Distribution (Y12), The Normal Distribution (Y12) Tagged With: Band 5, common-content, smc-6919-20-z-score Intervals, smc-819-20-z-score Intervals, smc-995-20-z-score Intervals

Statistics, STD2 S5 2010 HSC 4 MC

Which of the following frequency histograms shows data that could be normally distributed?
 

Capture1

Capture2 

Show Answers Only

`A`

Show Worked Solution

`text(Normally distributed data have a frequency)`

`text(histogram graph that is shaped like a bell.)`

`=>  A`

Filed Under: Bar Charts and Histograms, Bar Charts and Histograms, Bar Charts and Histograms, Displaying Data - Bar Charts and Histograms, DS5/6 - Normal Distribution and Sampling, Normal Distribution, S5 The Normal Distribution (Y12), The Normal Distribution (Y12) Tagged With: Band 4, common-content, smc-6310-20-Histograms, smc-6919-40-Graphs, smc-819-40-Graphs, smc-821-15-Histograms, smc-995-40-Graphs, smc-997-15-Histograms

Statistics, STD2 S5 2013 HSC 20 MC

There are  60 000  students sitting a state-wide examination. If the results form a normal distribution, how many students would be expected to score a result between 1 and 2 standard deviations above the mean?

You may assume for normally distributed data that:

    • 68% of scores have  `z`-scores between  – 1 and 1
    • 95% of scores have  `z`-scores between  – 2 and 2
    • 99.7% of scores have  `z`-scores between  – 3 and 3.
  1. `8100`
  2. `16\ 200`
  3. `20\ 400`
  4. `28\ 500`
Show Answers Only

`A`

Show Worked Solution
♦♦ Mean mark 24% 

`text(S)text(ince 68% between)\ z=1\ text(and)\ -1`

`  =>  text(34% between)\  z=0\ text(and)\   1`

`text(Likewise, 95% between)\ z=2\ text(and)  -2`

`  =>  text(47.5% between)\ z=0\ text(and)\ 2`
 

`:.\ text(% between)\ z=1\ text(and)\ 2`

`=47.5-34=13.5 text(%)`

 
`:.\ text(Students between)\ \ z=1\  text(and)\ \ z=2`

`=13.5 text(%)xx60\ 000=8100`

`=>\ A`

Filed Under: DS5/6 - Normal Distribution and Sampling, Normal Distribution, S5 The Normal Distribution (Y12), The Normal Distribution (Y12) Tagged With: Band 6, common-content, smc-6919-20-z-score Intervals, smc-819-20-z-score Intervals, smc-995-20-z-score Intervals

Copyright © 2014–2026 SmarterEd.com.au · Log in