The number of fruit drinks sold by a fast-food shop each day for 14 consecutive days was recorded.
These results are shown in the table below.

The six-mean smoothed value with centring for day 8 is
- 132
- 132.5
- 133
- 133.5
- 134
Aussie Maths & Science Teachers: Save your time with SmarterEd
The number of fruit drinks sold by a fast-food shop each day for 14 consecutive days was recorded.
These results are shown in the table below.
The six-mean smoothed value with centring for day 8 is
The table below shows the total number of cans of soft drink sold each month at a suburban cafe in 2023.
\begin{array}{|l|c|c|c|c|c|c|c|c|c|c|c|c|}
\hline
\rule{0pt}{2.5ex} \textbf{Month } \rule[-1ex]{0pt}{0pt}& 1 & 2 & 3 & 4 & 5 & 6 & 7 & 8 & 9 & 10 & 11 & 12 \\
\hline
\rule{0pt}{2.5ex} \textbf{Cans sold } \rule[-1ex]{0pt}{0pt}& 316 & 321 & 365 & 306 & 254 & 308 & 354 & 357 & 381 & 355 & 365 & 324 \\
\hline
\end{array}
The six-mean smoothed value of the number of cans sold, with centring, for month 5 is closest to
The daily number of cups of coffee sold by a food truck over a three-week period is shown in the table below.

The six-mean smoothed number of cups of coffee, with centring, sold on Thursday in Week 2 is closest to
The number of visitors to a public library each day for 10 consecutive days was recorded.
These results are shown in the table below.
\begin{array} {|l|c|c|c|c|c|c|c|c|c|}
\hline
\rule{0pt}{2.5ex} \textbf{Day number} \rule[-1ex]{0pt}{0pt} & 1 & 2 & 3 & 4 & 5 & 6 & 7 & 8 & 9 & 10 \\
\hline
\rule{0pt}{2.5ex} \textbf{Number of visitors} \rule[-1ex]{0pt}{0pt} & 337 & 317 & 313 & 335 & 322 & 335 & 322 & 338 & 302 & 349 \\
\hline
\end{array}
The eight-mean smoothed number of visitors with centring for day number 6 is
A garden centre sells garden soil.
The table below shows the daily quantity of garden soil sold, in cubic metres, over a one-week period.

The quantity of garden soil sold on Wednesday, Thursday and Friday is not shown.
The five-mean smoothed quantity of garden soil sold on Thursday is 206 m3.
The three-mean smoothed quantity of garden soil sold on Thursday, in cubic metres, is
The time series plot below displays the number of airline passengers, in thousands, each month during the period January to December 1960.

Part 1
During 1960, the median number of monthly airline passengers was closest to
Part 2
During the period January to May 1960, the total number of airline passengers was 2 160 000.
The five-mean smoothed number of passengers for March 1960 is
Table 4 below shows the monthly rainfall for 2019, in millimetres, recorded at a weather station, and the associated long-term seasonal indices for each month of the year.

Part 1
The deseasonalised rainfall for May 2019 is closest to
Part 2
The six-mean smoothed monthly rainfall with centring for August 2019 is closest to
The time series plot below shows the monthly rainfall at a weather station, in millimetres, for each month in 2017.

Part 1
The median monthly rainfall for 2017 was closest to
Part 2
If seven-mean smoothing is used to smooth this time series plot, the number of smoothed data points would be
The table below shows the monthly profit, in dollars, of a new coffee shop for the first nine months of 2018.

Using four-mean smoothing with centring, the smoothed profit for May is closest to
The wind speed at a city location is measured throughout the day.
The time series plot below shows the daily maximum wind speed, in kilometres per hour, over a three-week period.

Part 1
The time series is best described as having
Part 2
The seven-median smoothed maximum wind speed, in kilometres per hour, for day 4 is closest to
Part 3
The table below shows the daily maximum wind speed, in kilometres per hour, for the days in week 2.

A four-point moving mean with centring is used to smooth the time series data above.
The smoothed maximum wind speed, in kilometres per hour, for day 11 is closest to
`text(Part 1)`
`text(The time series plot shows no obvious trend and)`
`text(is over too short a period to show seasonality.)`
`=> B`
`text(Part 2)`
`text(Consider the 7 values where day 4 is the middle)`
`text(data point.)`

`text(By inspection of the graph, the 4th highest point = 30.)`
`=> D`
`text(Part 3)`
`text(Mean for Day 9 – 12)`
`= (22 + 19 + 22 + 43)/4 = 26.5`
`text(Mean for Day 10 – 13)`
`= (19 + 22 + 43 + 37)/4 = 30.25`
`:. 4text(-point moving mean with centring)`
`= (26.5 + 30.25)/2`
`= 28.375`
`=> D`
The time series plot below shows the minimum rainfall recorded at the weather station each month plotted against the month number (1 = January, 2 = February, and so on).
Rainfall is recorded in millimetres.
The data was collected over a period of one year.

The first four smoothed points are shown as crosses (×).
Complete the five-median smoothing by marking smoothed values with crosses (×) on the time series plot above. (2 marks)
--- 0 WORK AREA LINES (style=lined) ---
The maximum daily rainfall each month was also recorded at the weather station.
The table below shows the maximum daily rainfall each month for a period of one year.

The data in the table has been used to plot maximum daily rainfall against month number in the time series plot below.

The smoothed values are marked with crosses (×).
Using the data given in the table, show that the two-mean smoothed rainfall centred on October is 157.25 mm. (2 marks)
--- 5 WORK AREA LINES (style=lined) ---
| a. |  |
| b. | `text(Mean)\ _text(Sep-Oct)` | `= (124 + 140)/2` |
| `= 132\ text(mm)` | ||
| `text(Mean)\ _text(Oct-Nov)` | `= (140 + 225)/2` | |
| `= 182.5\ text(mm)` |
`:.\ text{Two mean (smoothed) for October}`
`= (132 +182.5)/2`
`= 157.25\ text(mm … as required)`
The table below displays the total monthly rainfall (in mm) in a reservoir catchment area over a one-year period.

Using three mean moving average smoothing, the smoothed value for the total rainfall in April is closest to
A. `65`
B. `66`
C. `70`
D. `75`
E. `88`
The table below shows the number of broadband users in Australia for each of the years from 2004 to 2008.

A two-point moving mean, with centring, is used to smooth the time series.
The smoothed value for the number of broadband users in Australia in 2006 is
A. `2 \ 958 \ 000`
B. `3 \ 379 \ 600`
C. `3 \ 455 \ 500`
D. `3 \ 661 \ 500`
E. `3 \ 900 \ 000`
The time series plot below shows the number of users each month of an online help service over a twelve-month period.

Part 1
The time series plot has
A. no trend.
B. no variability.
C. seasonality only.
D. an increasing trend with seasonality.
E. an increasing trend only.
Part 2
The data values used to construct the time series plot are given below.
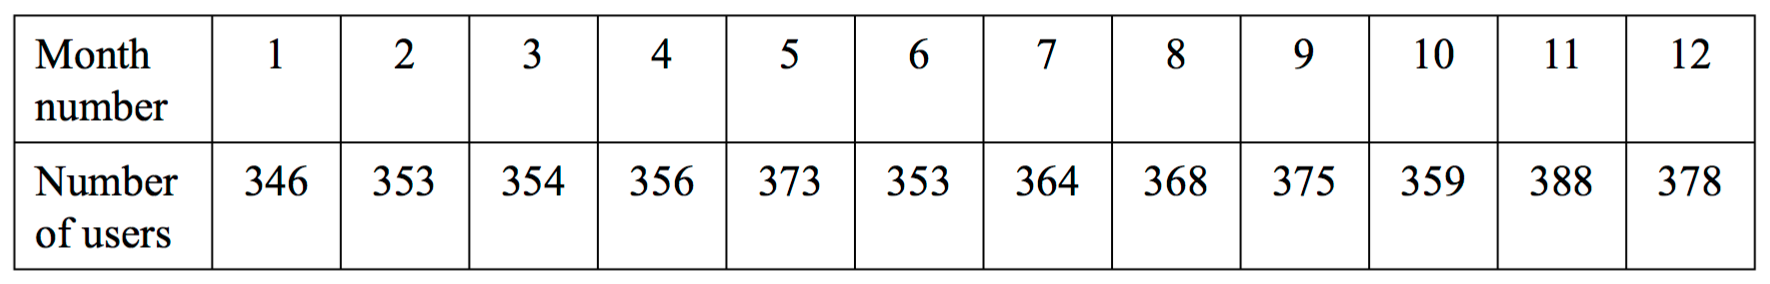
A four-point moving mean with centring is used to smooth timeline series.
The smoothed value of the number of users in month number 5 is closest to
A. `357`
B. `359`
C. `360`
D. `365`
E. `373`
Part 3
A least squares regression line is fitted to the time series plot.
The equation of this least squares regression line is
number of users = 346 + 2.77 × month number
Let month number 1 = January 2007, month number 2 = February 2007, and so on.
Using the above information, the regression line predicts that the number of users in December 2009 will be closest to
A. `379`
B. `412`
C. `443`
D. `446`
E. `448`
The time series plot below displays the number of guests staying at a holiday resort during summer, autumn, winter and spring for the years 2007 to 2012 inclusive.

Part 1
Which one of the following best describes the pattern in the time series?
A. random variation only
B. decreasing trend with seasonality
C. seasonality only
D. increasing trend only
E. increasing trend with seasonality
Part 2
The table below shows the data from the times series plot for the years 2007 and 2008.

Using four-mean smoothing with centring, the smoothed number of guests for winter 2007 is closest to
A. `85`
B. `107`
C. `183`
D. `192`
E. `200`