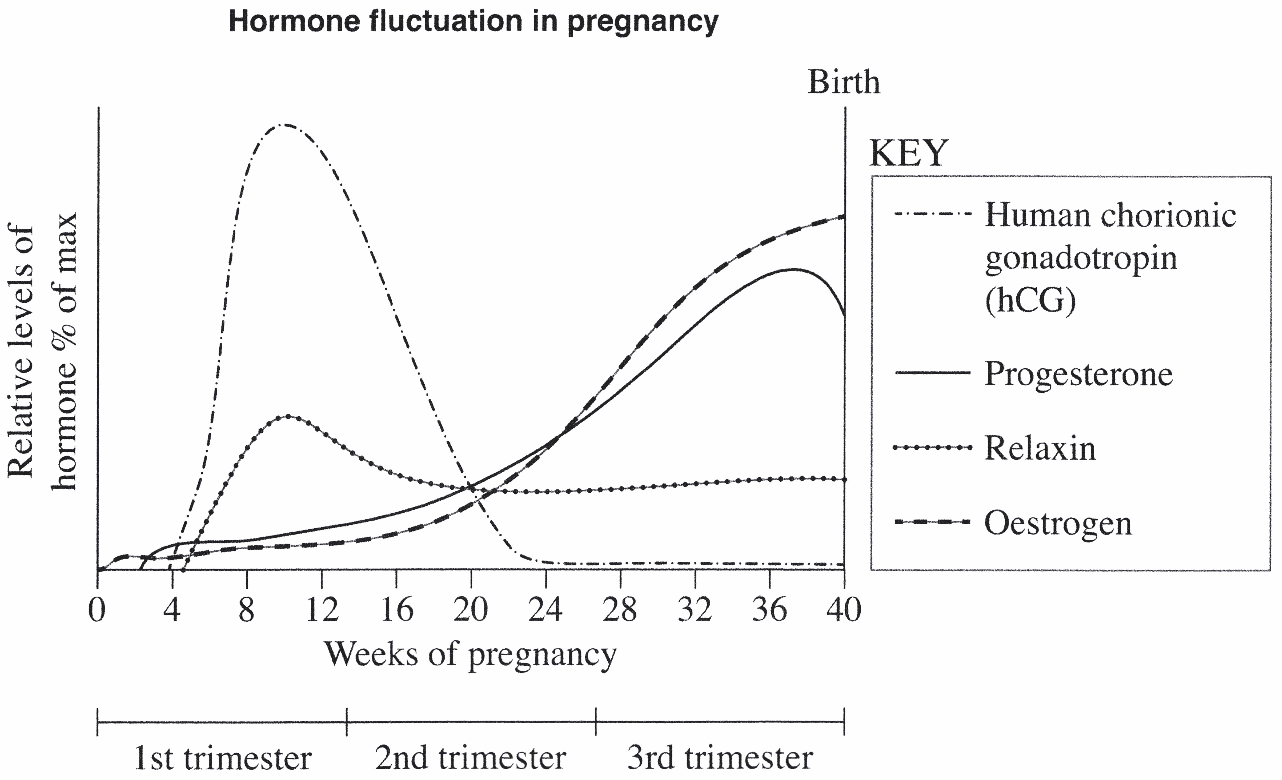
The following graph outlines some hormonal changes during pregnancy.

Complete the table for TWO of the hormones graphed. (4 marks)
\begin{array} {|c|c|c|}
\hline
\rule{0pt}{2.5ex} \quad \textit{Hormone name} \quad \rule[-1ex]{0pt}{0pt} & \quad \quad \textit{Function in pregnancy} \quad \quad & \quad \textit{Trimester where}\quad \\
\text{} \rule[-1.5ex]{0pt}{0pt} & \text{} & \textit{peak occurs}\\
\hline
\text{} & \text{} & \text{} \\
\text{} & \text{} & \text{}\\
\text{} & \text{} & \text{}\\
\text{} & \text{} & \text{}\\
\text{} & \text{} & \text{}\\
\text{} & \text{} & \text{} \\
\text{} & \text{} & \text{}\\
\text{} & \text{} & \text{}\\
\text{} & \text{} & \text{}\\
\text{} & \text{} & \text{}\\
\hline
\end{array}
--- 0 WORK AREA LINES (style=lined) ---