The Association of Southeast Asian Nations (ASEAN) has 10 member nations.
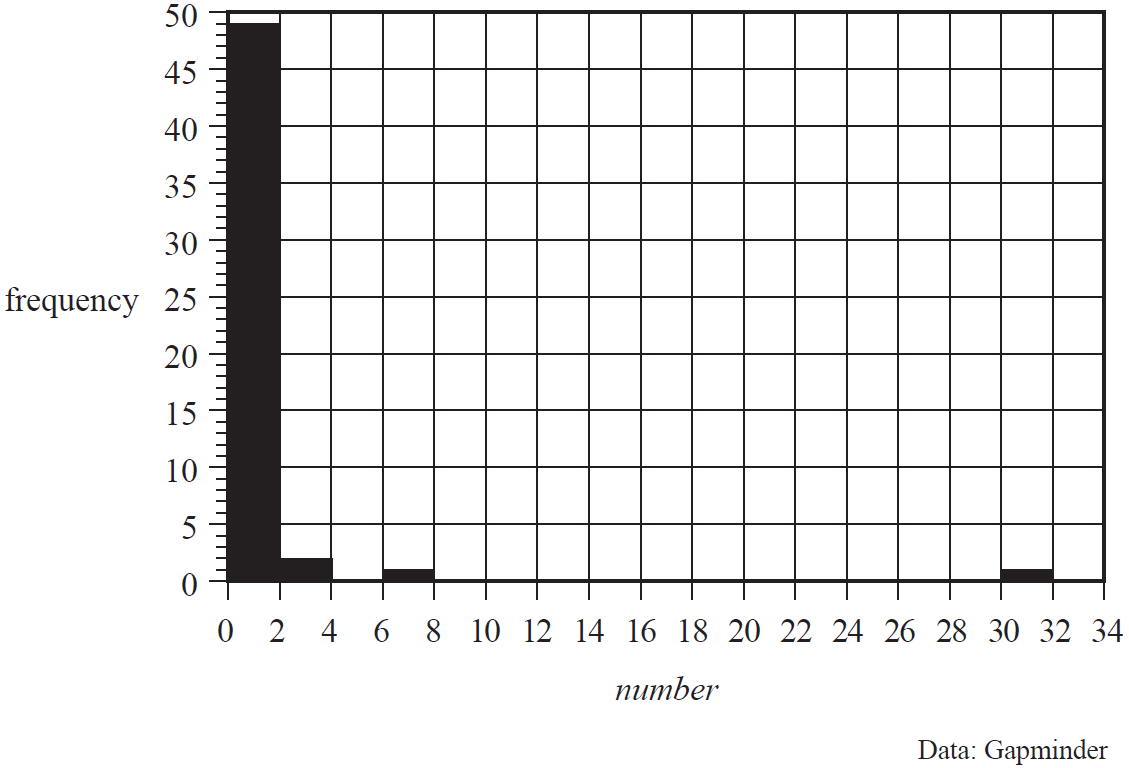
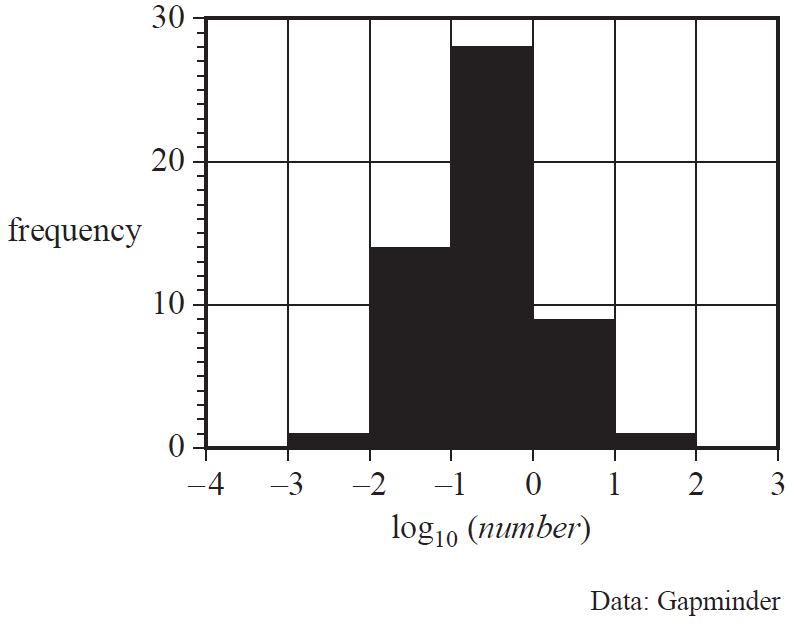
The population density, in people per km², for each of these nations in 2024 is displayed in the histogram below. The histogram has a logarithmic (base 10) scale.

Singapore is a member of ASEAN.
In 2024, Singapore's population was 6 028 460 and its total area was 720 km².
In which labelled column does the value of \(\log _{10}\)(population density) for Singapore lie?
- \(\text{A}\)
- \(\text{B}\)
- \(\text{C}\)
- \(\text{D}\)