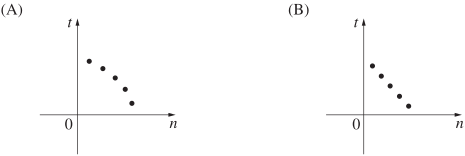
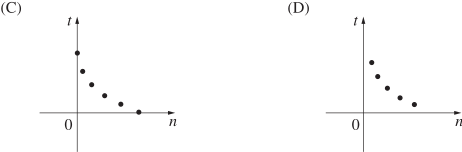
The time `(t)` taken to clean a house varies inversely with the number `(n)` of people
cleaning the house.
Which graph represents this relationship?
Aussie Maths & Science Teachers: Save your time with SmarterEd
The time `(t)` taken to clean a house varies inversely with the number `(n)` of people
cleaning the house.
Which graph represents this relationship?
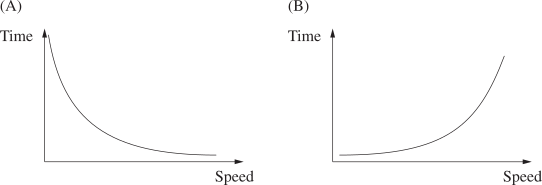
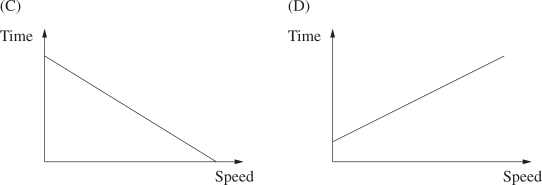
The time for a car to travel a certain distance varies inversely with its speed.
Which of the following graphs shows this relationship?