SmarterEd

Aussie Maths & Science Teachers: Save your time with SmarterEd

  • Login
  • Get Help
  • About

Statistics, NAP-J2-31

The bottles in Renee's fridge are pictured below.


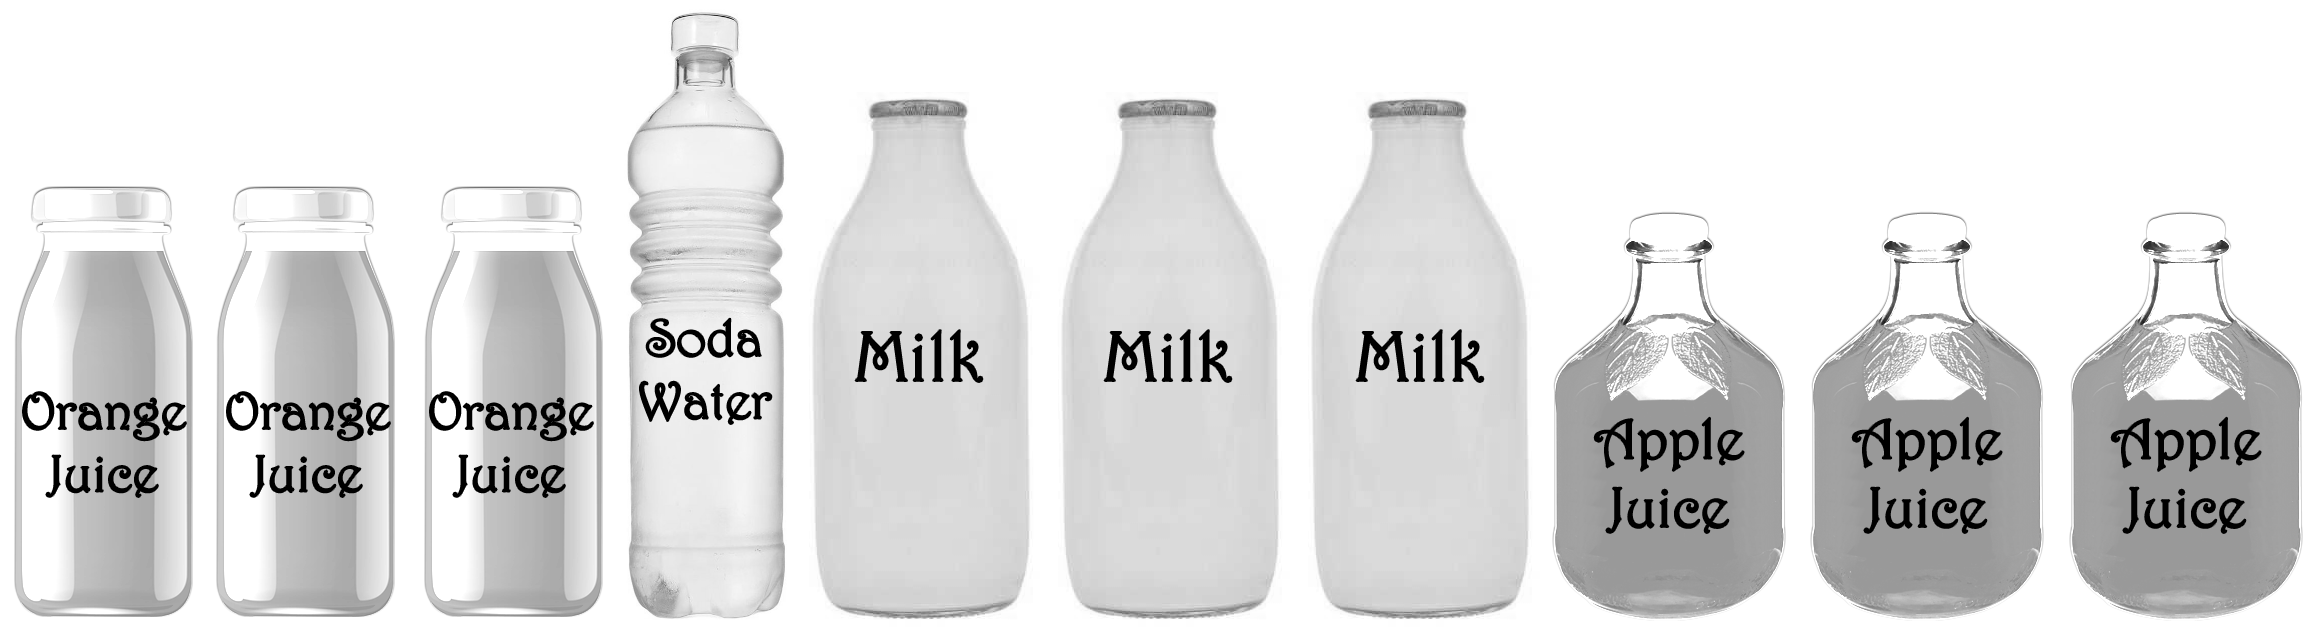
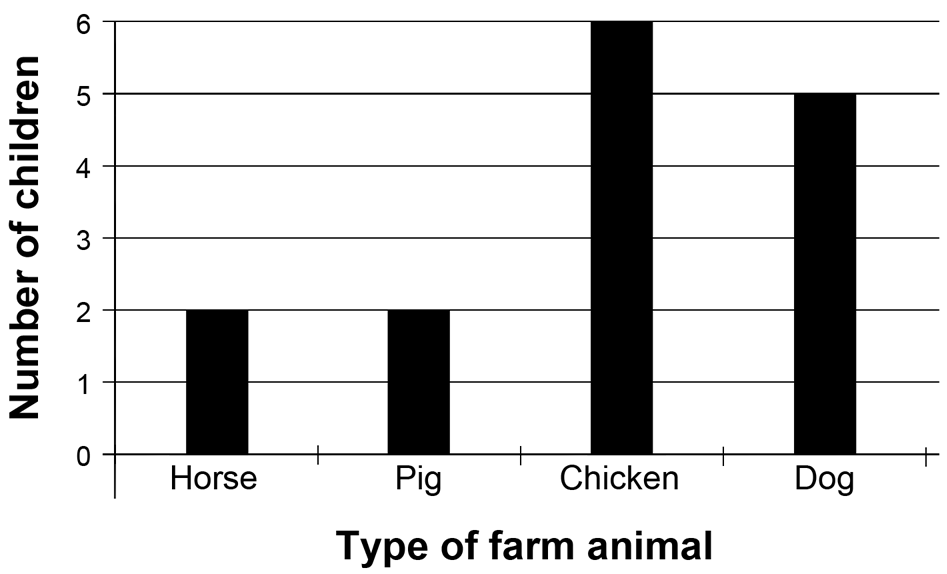
Renee decides to make a graph where each bar represents one type of bottle in her fridge.


Renee makes an error when creating the graph.

What should Renee do to correct the error?

 
Make each category bar a different colour.
 
Change the title to 'Number of bottles in the fridge by volume'.
 
Change the 'Number of bottles' label to 'Volume of bottles'.
 
Remove the 'Juice' category since orange juice and apple juice are already shown.
Show Answers Only

`text(Remove the ‘Juice’ category since orange juice and)`

`text(apple juice are already shown.)`

Show Worked Solution

`text(Remove the ‘Juice’ category since orange juice and)`

`text(apple juice are already shown.)`

Filed Under: Data and Interpretation, Data and Interpretation Tagged With: Band 5, smc-3136-20-Column graphs, smc-698-20-Column graphs

Statistics, NAP-K2-35

This graph shows the number of men and women that registered to vote before a council election on different days of the week.
  

On which day is the difference between the number of men and women registering closest to 50?

Monday Tuesday Wednesday Thursday Friday


Show Answers Only

`text(Tuesday)`

Show Worked Solution

`text(Each interval = 20 people)`

`text(Difference needs to be 2.5 intervals)`

`=>\ text(Tuesday is closest)`

Filed Under: Data and Interpretation, Data and Interpretation Tagged With: Band 8, smc-3136-20-Column graphs, smc-698-20-Column graphs

Statistics, NAP-K2-06

The table shows the time (in seconds) some children can run 100 metres.

Which column graph correctly shows the data in the table?


Show Answers Only

Show Worked Solution

`text(Considering the vertical scale of each option:)`
 

Filed Under: Data and Interpretation, Data and Interpretation, Data and Interpretation Tagged With: Band 4, smc-3052-20-Column graph, smc-3136-20-Column graphs, smc-698-20-Column graphs

Statistics, NAP-J2-13

Ms Richards asked her class a question and recorded the results in the table below.


Which question could Ms Richards have asked?

 
What type of farm animals do you own?
 
How many farm animals do you have?
 
What month was your farm animal born?
 
How old are your farm animals?
Show Answers Only

`text(What type of farm animals do you own?)`

Show Worked Solution

`text(What type of farm animals do you own?)`

Filed Under: Data and Interpretation, Data and Interpretation Tagged With: Band 5, smc-3136-20-Column graphs, smc-698-20-Column graphs

Statistics, NAP-F2-22

Camilla asked each student in four year 5 classes if they played soccer.

She recorded the results in the graph below. 


Which class had the highest number of students that played soccer?

`text(Class A)` `text(Class B)` `text(Class C)` `text(Class D)`


Show Answers Only

`text(Class A)`

Show Worked Solution

`text(Consider each option:)`

`text(Class A): 8+6=14`

`text(Class B): 10+3=13`

`text(Class C): 4+9=13`

`text(Class D): 11+2=13`

`:.\ text(Class A has the most soccer players.)`

Filed Under: Data and Interpretation, Data and Interpretation, Data and Interpretation Tagged With: Band 7, smc-3052-20-Column graph, smc-3136-20-Column graphs, smc-698-20-Column graphs

Statistics, NAP-C2-08

Some students at a country school were asked to name their favourite animal.

The four most popular choices were put on the graph below.

  • Dogs were the most popular.
  • Sheep were more popular than cats.
  • Horses were less popular than sheep.

Which column shows sheep on the graph?


`text(A)` `text(B)` `text(C)` `text(D)`


Show Answers Only

`text(B)`

Show Worked Solution

`text(Column D is dogs.)`

`text(S) text(ince horses are less popular than sheep)`

`text(and sheep are more popular than cats.)`

`=>\ text(Sheep are more popular than horses and cats.)`

`=>\ text(Column B is sheep.)`

Filed Under: Data and Interpretation, Data and Interpretation Tagged With: Band 5, smc-3136-20-Column graphs, smc-698-20-Column graphs

Statistics, NAP-G2-30

Rory is captain of the chess club and keeps a record of the number of students in the club at the end of each week.


If no students have left the club, how many joined in Week 3?

`3` `4` `5` `13` `17`


Show Answers Only

`4`

Show Worked Solution

`text(New members in Week 3)`

`=\ text(Members at end Week 3 – Members at end Week 2)`

`= 17 – 13`

`= 4`

Filed Under: Data and Interpretation, Data and Interpretation, Data and Interpretation Tagged With: Band 7, smc-3052-20-Column graph, smc-3136-20-Column graphs, smc-698-20-Column graphs

Statistics, NAP-E2-19

4 friends practiced taking soccer penalty goals.

They took 8 penalty with their right foot and another 8 penalty goals with their left foot.

The results are shown in the graph below.


Who scored the most penalty goals?

`text(Lionel)` `text(Kane)` `text(Tim)` `text(Pele)`


Show Answers Only

 `text(Pele)`

Show Worked Solution

`text(Consider each player:)`

`text(Lionel) = 3 + 7 = 10`

`text(Kane) = 6 + 4 = 10`

`text(Tim) = 7 + 2 = 9`

`text(Pele) = 6 + 5 = 11`

 `:.\ text(Pele scored the most penalty goals.)`

Filed Under: Data and Interpretation, Data and Interpretation Tagged With: Band 5, smc-3136-20-Column graphs, smc-698-20-Column graphs

Statistics, NAP-E2-32 SA

Matt and Libby planted 50 trees each over 3 weeks.

The bar chart below shows the amount of trees each planted in each week.
 

How many more trees did Libby plant than Matt in Week 2.

Show Answers Only

`5`

Show Worked Solution

`text(Trees planted by Matt in Week 2)`

`= 35 – 15`

`= 20`
 

`text(Trees planted by Libby in Week 2)`

`= 45 – 20`

`= 25`
 

`:.\ text(Libby planted 5 more trees than Matt in Week 2.)`

Filed Under: Data and Interpretation, Data and Interpretation Tagged With: Band 7, smc-3136-20-Column graphs, smc-3136-50-Other charts, smc-698-20-Column graphs, smc-698-50-Other charts

Statistics, NAP-H2-08

Virat had a stall that sold hats at the cricket.

The table below shows the number of hats of each size that he sold.

  • Large size were the most popular.
  • Small were less popular than extra large.
  • Medium were more popular than extra large.


Which column on the graph represents extra large?

`text(A)`   `text(B)`  `text(C)`  `text(D)`


Show Answers Only

`text(B)`

Show Worked Solution

`text{Large sold 15 (highest column).}`

`text(Extra large sold more than small and less)`

`text(than medium.)`

`:.\ text(Column B must be extra large.)`

Filed Under: Data and Interpretation, Data and Interpretation, Data and Interpretation Tagged With: Band 5, smc-3052-20-Column graph, smc-3136-20-Column graphs, smc-698-20-Column graphs

Statistics, NAP-I2-22

The number of students that could solve a Rubik's cube in less than 2 minutes were counted at 7 different primary schools.

The results were recorded in the graph below.
 

How many students, in total, could solve the cube in less than 2 minutes?

`3` `14` `15` `18`


Show Answers Only

`15`

Show Worked Solution

`text(Total students who can solve in 2 mins)`

`= 2+2+3+0+3+2+3`

`=15`

Filed Under: Data and Interpretation, Data and Interpretation Tagged With: Band 6, smc-3136-20-Column graphs, smc-698-20-Column graphs

Copyright © 2014–2025 SmarterEd.com.au · Log in