The container shown is initially full of water.

Water leaks out of the bottom of the container at a constant rate.
Which graph best shows the depth of water in the container as time varies?
| A. |  |
B. |  |
| C. |  |
D. |  |
Aussie Maths & Science Teachers: Save your time with SmarterEd
The container shown is initially full of water.
Water leaks out of the bottom of the container at a constant rate.
Which graph best shows the depth of water in the container as time varies?
| A. | |
B. | |
| C. | |
D. | |
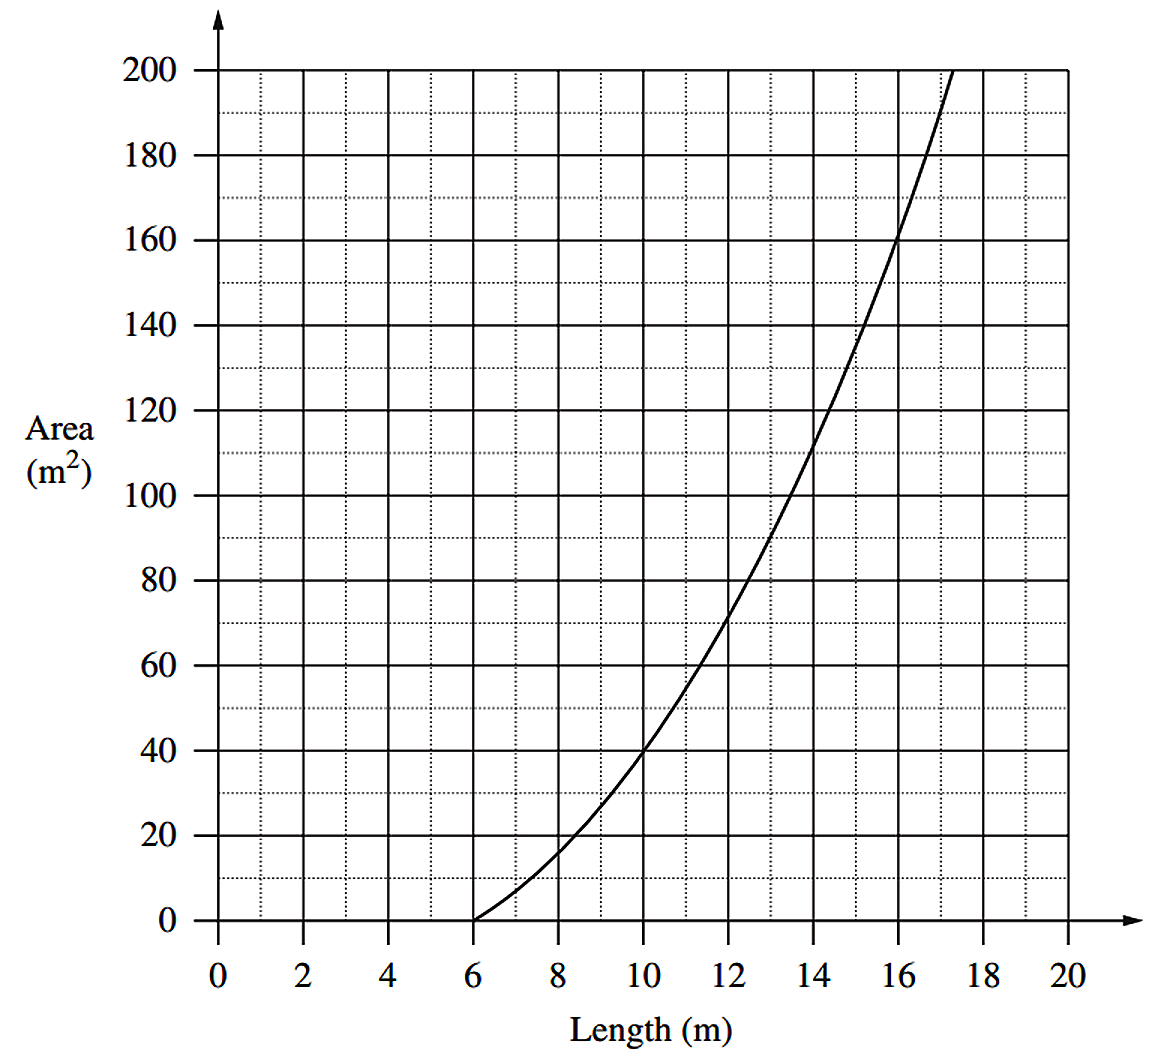
A rectangular playing surface is to be constructed so that the length is 6 metres more than the width.
--- 2 WORK AREA LINES (style=lined) ---
--- 1 WORK AREA LINES (style=lined) ---
A graph comparing the area of the playing surface to its length is shown.
--- 2 WORK AREA LINES (style=lined) ---
--- 4 WORK AREA LINES (style=lined) ---
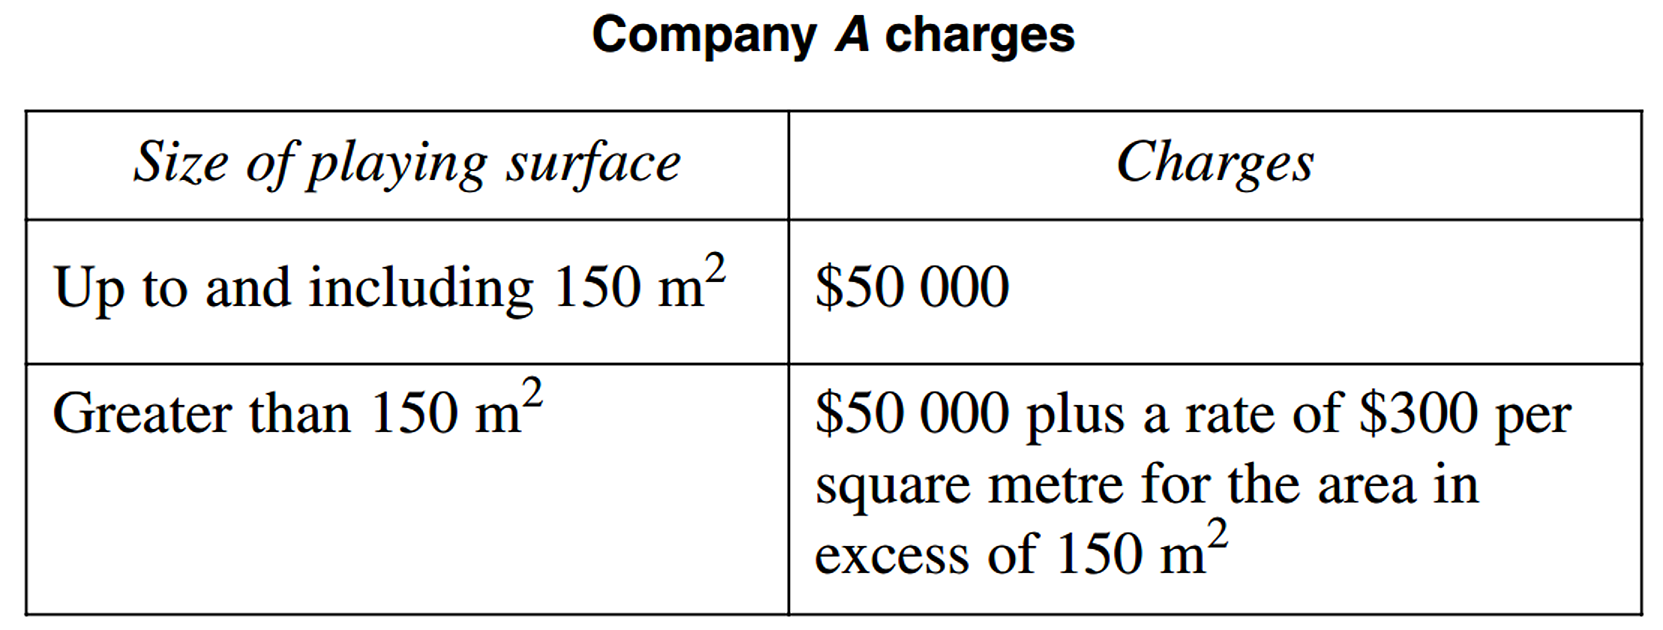
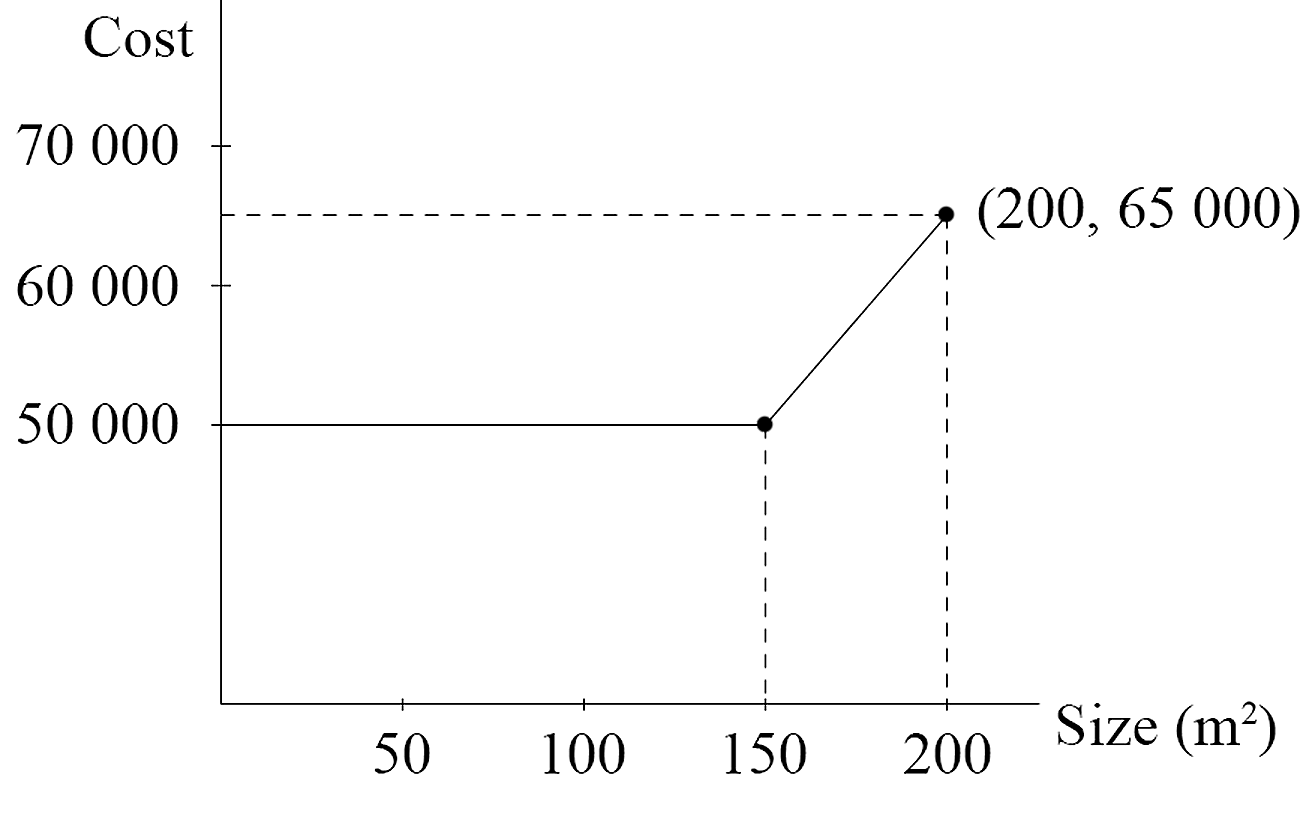
Company `A` constructs playing surfaces.
Use the horizontal axis to represent the area and the vertical axis to represent the cost. (2 marks)
--- 8 WORK AREA LINES (style=lined) ---
Justify your answer with suitable calculations. (1 mark)
--- 2 WORK AREA LINES (style=lined) ---
`text{of 4 m (among many possibilities).}`
`text(the width, it follows that the length)`
`text(must be greater than 6 m.)`
i. `text(One possibility is a length of 10 m, and a width)`
`text{of 4 m (among many possibilities).}`
ii. `text(Length) = l\ text(m)`
`text(Width) = (l – 6)\ text(m)`
| `:.\ A` | `= l (l – 6)` |
iii. `text(Given the length must be 6m more than the width,)`
`text(it follows that the length must be greater than 6 m)`
`text(so that the width is positive.)`
iv. `text(From the graph, an area of 135 m² corresponds to)`
`text(a length of 15 m.)`
`:.\ text(The dimensions would be 15 m × 9 m.)`
| v. | |
vi. `text(Company)\ A\ text(cost) = $50\ 000`
| `text(Company)\ B\ text(cost)` | `= 135 xx 360` |
| `= $48\ 600` |
`:.\ text(Company)\ B\ text(would charge $1400 less)`
`text(than Company)\ A.`
Lucy went for a bike ride. She left home at 8 am and arrived back at home at 6 pm. A graph representing her journey is shown.

--- 2 WORK AREA LINES (style=lined) ---
--- 2 WORK AREA LINES (style=lined) ---
The volume of water in a tank changes over six months, as shown in the graph.

Consider the overall decrease in the volume of water.
What is the average percentage decrease in the volume of water per month over this time, to the nearest percent?