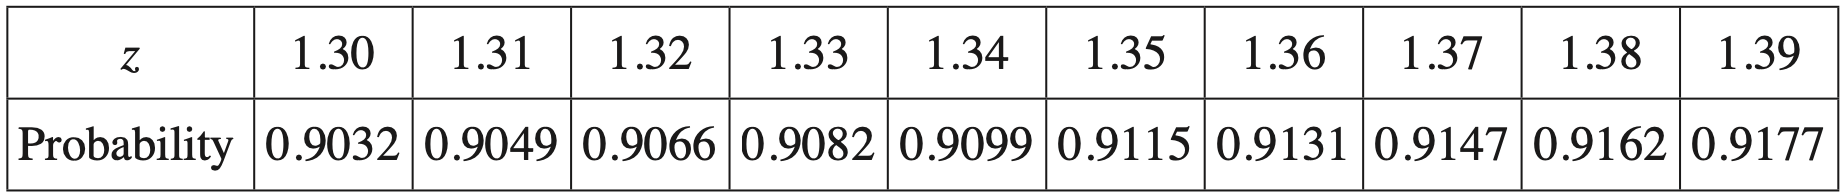
A random variable is normally distributed with mean 0 and standard deviation 1. The table gives the probability that this random variable is less than \(z\).
\begin{array} {|c|c|c|c|c|c|c|c|c|c|}
\hline
\rule{0pt}{2.5ex} z \rule[-1ex]{0pt}{0pt} & 0.6 & 0.7 & 0.8 & 0.9 & 1.0 & 1.1 & 1.2 & 1.3 & 1.4 \\
\hline
\rule{0pt}{2.5ex} \textit{Probability} \rule[-1ex]{0pt}{0pt} & 0.7257 & 0.7580 & 0.7881 & 0.8159 & 0.8413 & 0.8643 & 0.8849 & 0.9032 & 0.9192 \\
\hline
\end{array}
The probability values given in the table for different values of \(z\) are represented by the shaded area in the following diagram.

The scores in a university examination with a large number of candidates are normally distributed with mean 58 and standard deviation 15.
- By calculating a \(z\)-score, find the percentage of scores that are between 58 and 70. (2 marks)
--- 4 WORK AREA LINES (style=lined) ---
- Explain why the percentage of scores between 46 and 70 is twice your answer to part (a). (1 mark)
--- 2 WORK AREA LINES (style=lined) ---
- By using the values in the table above, find an approximate minimum score that a candidate would need to be placed in the top 10% of the candidates. (2 marks)
--- 4 WORK AREA LINES (style=lined) ---