SmarterEd

Aussie Maths & Science Teachers: Save your time with SmarterEd

  • Login
  • Get Help
  • About

Statistics, STD2 2026 HSC 11 MC

The graph of a normally distributed set of data is shown.
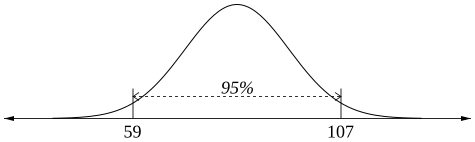
 

Which of the following is correct for this distribution?

  1. Modal score = 83,  range = 48
  2. Modal score = 107,  range = 48
  3. Modal score = 83,  standard deviation = 12
  4. Modal score = 107,  standard deviation = 12
Show Answers Only

\(C\)

Show Worked Solution

\(\text{Normal distribution}\ \ \Rightarrow\ \ \text{mode = mean (eliminate B and D)}\)

\(\text{Since 95% of values are between 59 and 107 (about the mean),}\)

\(\text{$z$-score (107) = 2}\)

\(\text{Mean}\ =\dfrac{59+107}{2}=83\)

\(107=83 + 2 \times \sigma\ \ \Rightarrow\ \ \sigma=12\)

\(\Rightarrow C\)

Filed Under: The Normal Distribution (Y12) Tagged With: Band 4, smc-6919-20-z-score Intervals, smc-6919-40-Graphs

Copyright © 2014–2026 SmarterEd.com.au · Log in