A teacher surveyed the students in her Year 8 class to investigate the relationship between the number of hours of phone use per day and the number of hours of sleep per day.
The results for five students are shown on the scatterplot. The least-squares regression line is also shown.
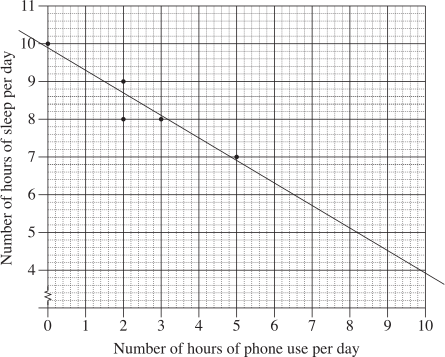
- Calculate Pearson's correlation coefficient \((r)\), to 4 decimal places, and describe the relationship between number of hours of sleep per day and number of hours of phone use per day. (3 marks)
--- 4 WORK AREA LINES (style=lined) ---
- Find the equation of the least-squares regression line. (2 marks)
--- 2 WORK AREA LINES (style=lined) ---
- From the data, the median number of hours of phone use per day, \(a\), and the median of the number of hours of sleep per day, \(b\), are to be calculated.
- By finding the coordinates \((a, b)\), determine whether this point would lie on, below or above the least-squares regression line. (3 marks)
--- 3 WORK AREA LINES (style=lined) ---