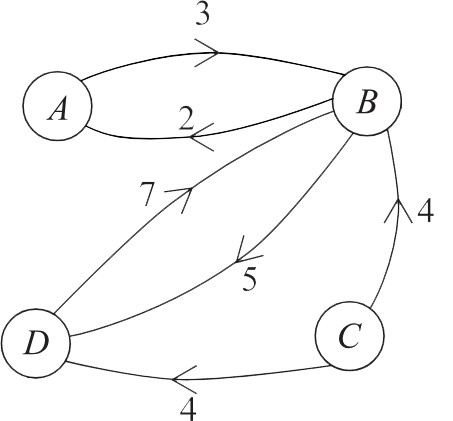
Consider the network diagram.

Which vertex has degree 4?
- \(A\)
- \(B\)
- \(C\)
- \(D\)
Aussie Maths & Science Teachers: Save your time with SmarterEd
Consider the network diagram.
Which vertex has degree 4?

In the graph shown above, the number of vertices of even degree is:
A supermarket has five departments, with areas allocated as shown on the floorplan below. The floorplan is represented by the network diagram below. On this network diagram, vertices represent departments and edges represent boundaries between two departments. This network diagram is incomplete. Draw the missing vertex and missing edges on the diagram above. Include a label. (2 marks) --- 0 WORK AREA LINES (style=lined) ---


The map shows regions within a country.

A network diagram is to be drawn to represent this map. Vertices will be used to indicate each region and edges will be used to represent a border shared between two regions.
How many edges will there be in the network diagram?
\(\text{Network diagram:}\)

\(\text{Network has 7 edges.}\)
\(\Rightarrow B\)
The map below shows seven countries within Central America.

Draw a network diagram of the map where seven vertices represent each of the countries on the map and edges represent a border shared between two countries. (2 marks)
--- 5 WORK AREA LINES (style=lined) ---

The table shows some of the flight distances (rounded to the nearest 10 km between various Australian cities. --- 1 WORK AREA LINES (style=lined) --- a. b. \(4190\text{ km}\) a. b. \(\text{Changing planes only once}\Rightarrow H\rightarrow S\rightarrow D\) \(\text{Kilometres travelled}=1040+3150=4190\text{ km}\)


Show Answers Only
 Show Worked Solution
The table below shows the distances, in kilometres, between a number of towns.


--- 0 WORK AREA LINES (style=lined) ---


a.
b. `text{Using Prim’s algorithm (starting at}\ Y):`
`text{1st edge:}\ YC`
`text{2nd edge:}\ CB`
`text{3rd edge:}\ SB`
`text{4th edge:}\ YM`
`text{Length of minimum spanning tree}`
`=275 + 150+60+530`
`=1015\ text{km}`
A network diagram is shown.

What is the number of edges in this network?
A network diagram is shown.

How many vertices are in this network?
Consider the network diagram.

What is the sum of the degrees of all the vertices in this network?
Which of the following network diagrams is NOT a tree?
 |
 |
 |
|
Which of the following networks has more vertices than edges?
 |
 |
|
|
|
|
A regional airline operates flights in Queensland. Flight times between connected towns are shown in the table.

Draw a network diagram to show how the towns are connected, with weights on the edges showing the flight times. (2 marks)

`text(Edge weights are in minutes duration.)`
A network diagram is given.

What is the degree of vertex `W`?
Consider the graph below.

Which one of the following is not a path for this graph?
In central Queensland, there are four petrol stations `A`, `B`, `C` and `D`. The table shows the length, in kilometres, of roads connecting these petrol stations.

--- 5 WORK AREA LINES (style=lined) ---
Calculate the shortest distance that can be travelled by the petrol tanker. In your answer, include the order the petrol stations are refilled. (2 marks)
--- 4 WORK AREA LINES (style=lined) ---

| a. | |
b. `text(Shortest Path from)\ A\ (text(visiting all stations))`
`A – B – D – C`
| `text(Distance)` | `= 170 + 90 + 120` |
| `= 380\ text(km)` |
A directed network diagram is pictured below.
The information in the network diagram is used to complete the network table below, with a "0" used to signify that no connection exists. Complete the table. (2 marks)

--- 0 WORK AREA LINES (style=lined) ---

The table below represents a directed network.

Complete the network diagram below to accurately reflect the network described in the above table. (2 marks)

--- 0 WORK AREA LINES (style=lined) ---

A table is constructed to represent the network diagram below.

Complete the table. (2 marks)

--- 0 WORK AREA LINES (style=lined) ---

A network of roads between towns shows the travelling times in minutes between towns that are directly connected.
Complete the shaded cells in the following table so that it represents the information in this network. (2 marks)

--- 0 WORK AREA LINES (style=lined) ---

`text(Note the symmetry in this table across the diagonal.)`
The city of Robville is divided into five suburbs labelled as `A` to `E` on the map below.
A lake which is situated in the city is shaded on the map.

A table is constructed to represent the number of land borders between suburbs.
If there is no land border between two suburbs, the table records a '0'. If there is a single land border between two suburbs, the table records a '1', and if there are two separate land borders between the same two suburbs, the table records a '2'.
`{:({:\ qquadAquadBquadCquadDquadE:}),({:(A),(B),(C),(D),(E):}[(0,1,1,1,0),(1,0,1,2,0),(1,1,0,0,0),(1,2,0,0,0),(0,0,0,0,0)]):}`
--- 2 WORK AREA LINES (style=lined) ---
In the network diagram below, vertices represent suburbs and edges represent land borders between suburbs.
The diagram has been started but is not finished.

On the diagram
--- 0 WORK AREA LINES (style=lined) ---
a. `E\ text(has no land borders with other suburbs.)`
| b.i. & ii. | |
The map of Australia shows the six states, the Northern Territory and the Australian Capital Territory (ACT).

In the network diagram below, each of the vertices `A` to `H` represents one of the states or territories shown on the map of Australia. The edges represent a border shared between two states or between a state and a territory.

--- 1 WORK AREA LINES (style=lined) ---
--- 4 WORK AREA LINES (style=lined) ---
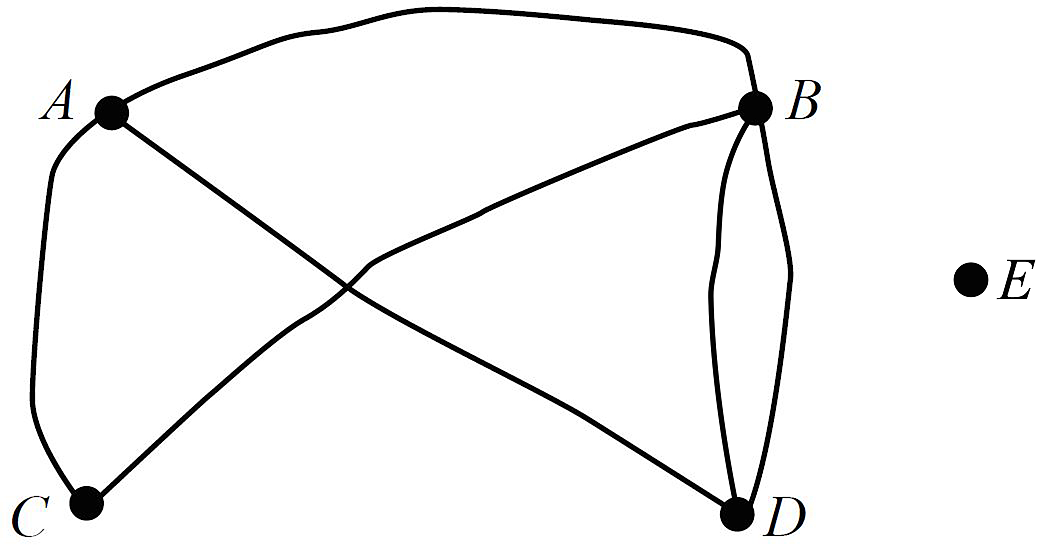
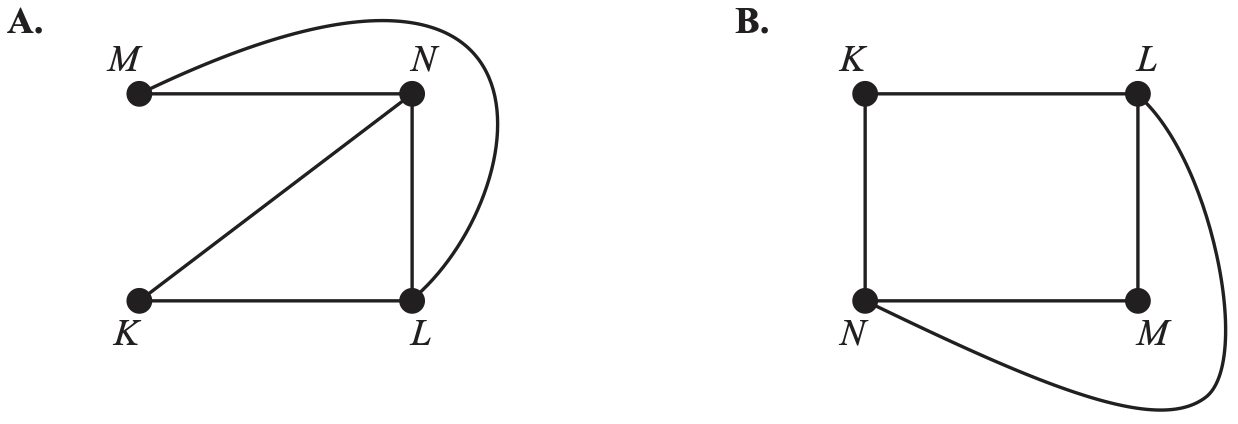
The graph below represents a friendship network. The vertices represent the four people in the friendship network: Kwan (K), Louise (L), Milly (M) and Narelle (N).
An edge represents the presence of a friendship between a pair of these people. For example, the edge connecting K and L shows that Kwan and Louise are friends.

Which one of the following graphs does not contain the same information.


In the network shown, the number of vertices of even degree is
Two graphs, labelled Graph 1 and Graph 2, are shown below.

The sum of the degrees of the vertices of Graph 1 is
A store manager is directly in charge of five department managers.
Each department manager is directly in charge of six sales people in their department.
This staffing structure could be represented graphically by
A. a tree.
B. a path.
C. a cycle.
D. a weighted graph.

The number of vertices with an odd degree in the network above is

In the graph above, the number of vertices of odd degree is
Which one of the following graphs is a tree?


The number of edges in the graph above is

The sum of the degrees of all the vertices in the graph above is
A. `6`
B. `9`
C. `11`
D. `12`


