The Olympic gold medal-winning height for the women's high jump, \(\textit{Wgold}\), is often lower than the best height achieved in other international women's high jump competitions in that same year. The table below lists the Olympic year, \(\textit{year}\), the gold medal-winning height, \(\textit{Wgold}\), in metres, and the best height achieved in all international women's high jump competitions in that same year, \(\textit{Wbest}\), in metres, for each Olympic year from 1972 to 2020. A scatterplot of \(\textit{Wbest}\) versus \(\textit{Wgold}\) for this data is also provided. Wgold Wbest When a least squares line is fitted to the scatterplot, the equation is found to be: \(Wbest =0.300+0.860 \times Wgold\) The correlation coefficient is 0.9318 --- 1 WORK AREA LINES (style=lined) --- --- 0 WORK AREA LINES (style=lined) --- --- 1 WORK AREA LINES (style=lined) --- --- 0 WORK AREA LINES (style=lined) --- \begin{array}{|l|l|} --- 3 WORK AREA LINES (style=lined) --- --- 4 WORK AREA LINES (style=lined) --- --- 0 WORK AREA LINES (style=lined) --- --- 3 WORK AREA LINES (style=lined) --- --- 2 WORK AREA LINES (style=lined) ---
year
1972
1976
1980
1984
1988
1992
1996
2000
2004
2008
2012
2016
2020
(m)1.92
1.93
1.97
2.02
2.03
2.02
2.05
2.01
2.06
2.05
2.05
1.97
2.04
(m)1.94
1.96
1.98
2.07
2.07
2.05
2.05
2.02
2.06
2.06
2.05
2.01
2.05
\hline
\rule{0pt}{2.5ex}\text { strength } \rule[-1ex]{0pt}{0pt} & \quad \quad\quad\quad\quad\quad\quad\quad\quad\quad\quad\\
\hline
\rule{0pt}{2.5ex}\text { direction } \rule[-1ex]{0pt}{0pt} & \\
\hline
\end{array}
Data Analysis, GEN2 2023 VCAA 3
The scatterplot below plots the average monthly ice cream consumption, in litres/person, against average monthly temperature, in °C. The data for the graph was recorded in the Northern Hemisphere.
When a least squares line is fitted to the scatterplot, the equation is found to be:
consumption = 0.1404 + 0.0024 × temperature
The coefficient of determination is 0.7212
- Draw the least squares line on the scatterplot graph above. (1 mark)
--- 0 WORK AREA LINES (style=lined) ---
- Determine the value of the correlation coefficient \(r\).
- Round your answer to three decimal places. (1 mark)
--- 1 WORK AREA LINES (style=lined) ---
- Describe the association between average monthly ice cream consumption and average monthly temperature in terms of strength, direction and form. (1 mark)
--- 0 WORK AREA LINES (style=lined) ---
\begin{array} {|l|c|}
\hline
\rule{0pt}{2.5ex} \textbf{strength} \rule[-1ex]{0pt}{0pt} & \quad \quad \quad \quad \quad \quad \quad \quad \\
\hline
\rule{0pt}{2.5ex} \textbf{direction} \rule[-1ex]{0pt}{0pt} & \\
\hline
\rule{0pt}{2.5ex} \textbf{form} \rule[-1ex]{0pt}{0pt} & \\
\hline
\end{array} - Referring to the equation of the least squares line, interpret the value of the intercept in terms of the variables consumption and temperature. (1 mark)
--- 3 WORK AREA LINES (style=lined) ---
- Use the equation of the least squares line to predict the average monthly ice cream consumption, in litres per person, when the monthly average temperature is –6°C. (1 mark)
--- 2 WORK AREA LINES (style=lined) ---
- Write down whether this prediction is an interpolation or an extrapolation. (1 mark)
--- 1 WORK AREA LINES (style=lined) ---
Data Analysis, GEN1 2022 VCAA 7-8 MC
The association between the weight of a seal's spleen, spleen weight, in grams, and its age, in months, for a sample of seals is non-linear.
This association can be linearised by applying a \(\log _{10}\) transformation to the variable spleen weight.
The equation of the least squares line for this scatterplot is
\(\log _{10}\) (spleen weight) = 2.698 + 0.009434 × age
Question 7
The equation of the least squares line predicts that, on average, for each one-month increase in the age of the seals, the increase in the value of \(\log _{10}\) (spleen weight) is
- 0.009434
- 0.01000
- 1.020
- 2.698
- 5.213
Question 8
Using the equation of the least squares line, the predicted spleen weight of a 30-month-old seal, in grams, is
- 3
- 511
- 772
- 957
- 1192
Data Analysis, GEN2 2023 VCAA 1
Data was collected to investigate the use of electronic images to automate the sizing of oysters for sale. The variables in this study were:
-
- ID: identity number of the oyster
- weight: weight of the oyster in grams (g)
- volume: volume of the oyster in cubic centimetres (cm³)
- image size: oyster size determined from its electronic image (in megapixels)
- size: oyster size when offered for sale: small, medium or large
The data collected for a sample of 15 oysters is displayed in the table.
- Write down the number of categorical variables in the table. (1 mark)
- Determine, in grams:
- the mean weight of all the oysters in this sample. (1 mark)
- the median weight of the large oysters in this sample. (1 mark)
- When a least squares line is used to model the association between oyster weight and volume, the equation is:
\(\textit{volume} = 0.780 + 0.953 \times \textit{weight} \)
-
- Name the response variable in this equation.
- Complete the following sentence by filling in the blank space provided.
- This equation predicts that, on average, each 10 g increase in the weight of an oyster is associated with a ________________ cm³ increase in its volume.
- A least squares line can also be used to model the association between an oyster's volume, in cm³, and its electronic image size, in megapixels. In this model, image size is the explanatory variable.
- Using data from the table, determine the equation of this least squares line. Use the template below to write your answer. Round the values of the intercept and slope to four significant figures.
- The number of megapixels needed to construct an accurate electronic image of an oyster is approximately normally distributed.
- Measurements made on recently harvested oysters showed that:
-
- 97.5% of the electronic images contain less than 4.6 megapixels
- 84% of the electronic images contain more than 4.3 megapixels.
- Use the 68-95-99.7% rule to determine, in megapixels, the mean and standard deviation of this normal distribution.
Data Analysis, GEN1 2023 VCAA 11-12 MC
The table below shows the height, in metres, and the age, in years, for 11 plantation trees. A scatterplot displaying this data is also shown.
Question 11
A reciprocal transformation applied to the variable age can be used to linearise the scatterplot.
With \(\dfrac{1}{\textit{age}}\) as the explanatory variable, the equation of the least squares line fitted to the linearised data is closest to
- \(\textit{height}\ =-13.04 + 40.22 \times \dfrac{1}{\textit{age}}\)
- \(\textit{height}\ =-10.74+8.30 \times \dfrac{1}{\textit{age}}\)
- \(\textit{height}\ =2.14 + 0.63 \times \dfrac{1}{\textit{age}}\)
- \(\textit{height}\ =13.04-40.22 \times \dfrac{1}{\textit{age}}\)
- \(\textit{height}\ =16.56-22.47 \times \dfrac{1}{\textit{age}}\)
Question 12
The scatterplot can also be linearised using a logarithm (base 10) transformation applied to the variable age.
The equation of the least squares line is
\(\textit{height }=-3.8+12.6 \times \log _{10}(\textit{age}) \)
Using this equation, the age, in years, of a tree with a height of 8.52 m is closest to
- 7.9
- 8.9
- 9.1
- 9.5
- 9.9
Data Analysis, GEN1 2023 VCAA 7-8 MC
A teacher analysed the class marks of 15 students who sat two tests.
The test 1 mark and test 2 mark, all whole number values, are shown in the scatterplot below.
A least squares line has been fitted to the scatterplot.
Question 7
The equation of the least squares line is closest to
- test 2 mark = – 6.83 + 1.55 × test 1 mark
- test 2 mark = 15.05 + 0.645 × test 1 mark
- test 2 mark = – 6.78 + 0.645 × test 1 mark
- test 2 mark = 1.36 + 1.55 × test 1 mark
- test 2 mark = 6.83 + 1.55 × test 1 mark
Question 8
The least squares line shows the predicted test 2 mark for each student based on their test 1 mark.
The number of students whose actual test 2 mark was within two marks of that predicted by the line is
- 3
- 4
- 5
- 6
- 7
CORE, FUR2 2021 VCAA 4
The time series plot below shows that the winning time for both men and women in the 100 m freestyle swim in the Olympic Games has been decreasing during the period 1912 to 2016.
Least squares lines are used to model the trend for both men and women.
The least squares line for the men's winning time has been drawn on the time series plot above.
The equation of the least squares line for men is
winning time men = 356.9 – 0.1544 × year
The equation of the least squares line for women is
winning time women = 538.9 – 0.2430 × year
- Draw the least squares line for winning time women on the time series plot above. (1 mark)
- The difference between the women's predicted winning time and the men's predicted winning time can be calculated using the formula.
- difference = winning time women – winning time men
- Use the equation of the least squares lines and the formula above to calculate the difference predicted for the 2024 Olympic Games.
- Round your answer to one decimal place. (2 marks)
- The Olympic Games are held every four years. The next Olympic Games will be held in 2024, then 2028, 2032 and so on.
- In which Olympic year do the two least squares lines predict that the wining time for women will first be faster than the winning time for men in the 100 m freesytle? (2 marks)
CORE, FUR2 2021 VCAA 3
The time series plot below shows the winning time, in seconds, for the women's 100 m freestyle swim plotted against year, for each year that the Olympic Games were held during the period 1956 to 2016.
A least squares line has been fitted to the plot to model the decreasing trend in the winning time over this period.
The equation of the least squares line is
winning time = 357.1 – 0.1515 × year
The coefficient of determination is 0.8794
- Name the explanatory variable in this time series plot. (1 mark)
- Determine the value of the correlation coefficient (`r`).
- Round your answer to three decimal places. (1 mark)
- Write down the average decrease in winning time, in seconds per year, during the period 1956 to 2016. (1 mark)
- The predicted winning time for the women's 100 m freestyle in 2000 was 54.10 seconds.
- The actual winning time for the women's 100 m freestyle in 2000 was 53.83 seconds.
- Determine the residual value in seconds. (1 mark)
- The following equation can be used to predict the winning time for the women's 100 m freestyle in the future.
- winning time = 357.1 – 0.1515 × year
- i. Show that the predicted winning time for the women's 100 m freestyle in 2032 is 49.252 seconds. (1 mark)
- ii. What assumption is being made when this equation is used to predict the winning time for the women's 100 m freestyle in 2032? (1 mark)
CORE, FUR2 2020 VCAA 5
The scatterplot below shows body density, in kilograms per litre, plotted against waist measurement, in centimetres, for 250 men.
When a least squares line is fitted to the scatterplot, the equation of this line is
body density = 1.195 – 0.001512 × waist measurement
- Draw the graph of this least squares line on the scatterplot above. (1 mark)
(Answer on the scatterplot above.)
- Use the equation of this least squares line to predict the body density of a man whose waist measurement is 65 cm.
Round your answer to two decimal places. (1 mark)
- When using the equation of this least squares line to make the prediction in part b., are you extrapolating or interpolating? (1 mark)
- Interpret the slope of this least squares line in terms of a man’s body density and waist measurement. (1 mark)
- In this study, the body density of the man with a waist measurement of 122 cm was 0.995 kg/litre.
Show that, when this least squares line is fitted to the scatterplot, the residual, rounded to two decimal places, is –0.02 (1 mark)
- The coefficient of determination for this data is 0.6783
Write down the value of the correlation coefficient `r`.
Round your answer to three decimal places. (1 mark)
- The residual plot associated with fitting a least squares line to this data is shown below.
Does this residual plot support the assumption of linearity that was made when fitting this line to this data? Briefly explain your answer. (1 mark)
CORE, FUR1 2020 VCAA 13 MC
A least squares line of the form `y = a + bx` is fitted to a scatterplot.
Which one of the following is always true?
- As many of the data points in the scatterplot as possible will lie on the line.
- The data points in the scatterplot will be divided so that there are as many data points above the line as there are below the line.
- The sum of the squares of the shortest distances from the line to each data point will be a minimum.
- The sum of the squares of the horizontal distances from the line to each data point will be a minimum.
- The sum of the squares of the vertical distances from the line to each data point will be a minimum.
CORE, FUR1-NHT 2019 VCAA 9 MC
A least squares line of the form `y = a + bx` is fitted to a set of bivariate data for the variables `x` and `y`.
For this set of bivariate data, `barx = 5.50`, `bary = 5.60`, `s_x = 3.03`, `s_y =1.78` and `a = 3.1`
The slope of the least squares line, `b`, is closest to
- 0.44
- 0.45
- 0.58
- 0.59
- 0.76
CORE, FUR2 2019 VCAA 5
The scatterplot below shows the atmospheric pressure, in hectopascals (hPa), at 3 pm (pressure 3 pm) plotted against the atmospheric pressure, in hectopascals, at 9 am (pressure 9 am) for 23 days in November 2017 at a particular weather station.
A least squares line has been fitted to the scatterplot as shown.
The equation of this line is
pressure 3 pm = 111.4 + 0.8894 × pressure 9 am
- Interpret the slope of this least squares line in terms of the atmospheric pressure at this weather station at 9 am and at 3 pm. (1 mark)
- Use the equation of the least squares line to predict the atmospheric pressure at 3 pm when the atmospheric pressure at 9 am is 1025 hPa.
Round your answer to the nearest whole number. (1 mark)
- Is the prediction made in part b. an example of extrapolation or interpolation? (1 mark)
- Determine the residual when the atmospheric pressure at 9 am is 1013 hPa.
Round your answer to the nearest whole number. (1 mark)
- The mean and the standard deviation of pressure 9 am and pressure 3 pm for these 23 days are shown in Table 4 below.
-
- Use the equation of the least squares line and the information in Table 4 to show that the correlation coefficient for this data, rounded to three decimal places, is `r` = 0.966 (1 mark)
- What percentage of the variation in pressure 3 pm is explained by the variation in pressure 9 am?
Round your answer to one decimal place. (1 mark)
- The residual plot associated with the least squares line is shown below.
-
- The residual plot above can be used to test one of the assumptions about the nature of the association between the atmospheric pressure at 3 pm and the atmospheric pressure at 9 am.
What is this assumption? (1 mark)
- The residual plot above does not support this assumption.
Explain why. (1 mark)
- The residual plot above can be used to test one of the assumptions about the nature of the association between the atmospheric pressure at 3 pm and the atmospheric pressure at 9 am.
CORE, FUR1 2019 VCAA 11 MC
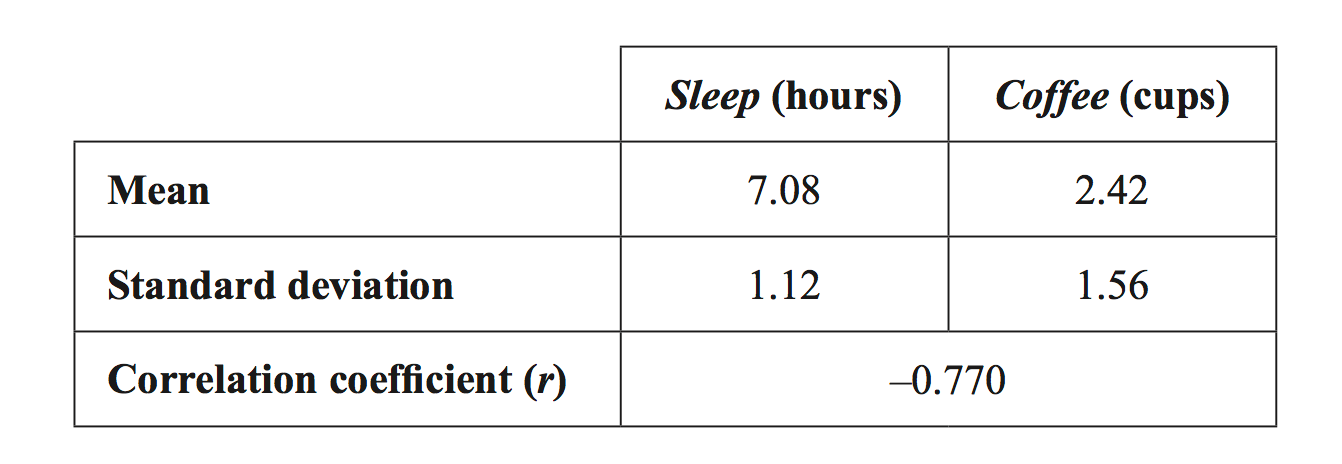
A study was conducted to investigate the effect of drinking coffee on sleep.
In this study, the amount of sleep, in hours, and the amount of coffee drunk, in cups, on a given day were recorded for a group of adults.
The following summary statistics were generated.
On average, for each additional cup of coffee drunk, the amount of sleep
- decreased by 0.55 hours.
- decreased by 0.77 hours.
- decreased by 1.1 hours.
- increased by 1.1 hours.
- increased by 2.3 hours.
CORE, FUR1 2018 VCAA 13 MC
CORE, FUR2 2013 VCAA 3
The development index and the average pay rate for workers, in dollars per hour, for a selection of 25 countries are displayed in the scatterplot below.
The table below contains the values of some statistics that have been calculated for this data.
- Determine the standardised value of the development index (`z` score) for a country with a development index of 91.
Write your answer, correct to one decimal place. (1 mark)
- Use the information in the table to show that the equation of the least squares regression line for a country’s development index, `y`, in terms of its average pay rate, `x`, is given by
`y = 81.3 + 0.272x` (2 marks) - The country with an average pay rate of $14.30 per hour has a development index of 83.
Determine the residual value when the least squares regression line given in part (b) is used to predict this country’s development index.
Write your answer, correct to one decimal place. (2 marks)
CORE, FUR1 2010 VCAA 10 MC
For a set of bivariate data that involves the variables `x` and `y`, with `y` as the response variable
`r = – 0.644, \ \ barx = 5.30, \ \ bary = 5.60, \ \ s_x = 3.06, \ \ s_y = 3.20`
The equation of the least squares regression line is closest to
A. `y = 9.2 - 0.7x`
B. `y = 9.2 + 0.7x`
C. `y = 2.0 - 0.6x`
D. `y = 2.0 - 0.7x`
E. `y = 2.0 + 0.7x`
CORE, FUR1 2015 VCAA 10 MC
For a set of bivariate data that involves the variables `x` and `y`:
`r = –0.47`, `barx = 1.8`, `s_x = 1.2`, `bary = 7.2`, `s_y = 0.85`
Given the information above, the least squares regression line predicting `y` from `x` is closest to
A. `y = 8.4 - 0.66x`
B. `y = 8.4 + 0.66x`
C. `y = 7.8 - 0.33x`
D. `y = 7.8 + 0.33x`
E. `y = 1.8 + 5.4x`
CORE, FUR1 2006 VCAA 7 MC
For a set of bivariate data, involving the variables `x` and `y`,
`r =– 0.5675, \ bar x = 4.56, \ s_x = 2.61, \ bar y = 23.93 \ and\ s_y = 6.98`
The equation of the least squares regression line `y = a + bx` is closest to
A. `y= 30.9 - 1.52x`
B. `y = 17.0 - 1.52x`
C. `y = – 17.0 + 1.52x`
D. `y = 30.9 - 0.2x`
E. `y = 24.9 - 0.2x`