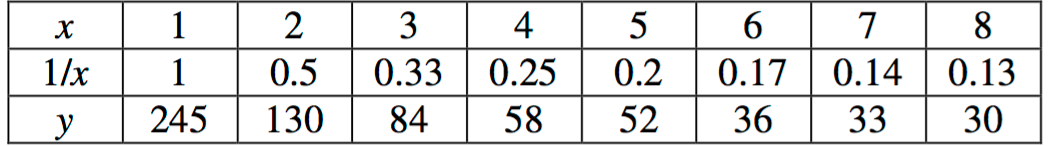
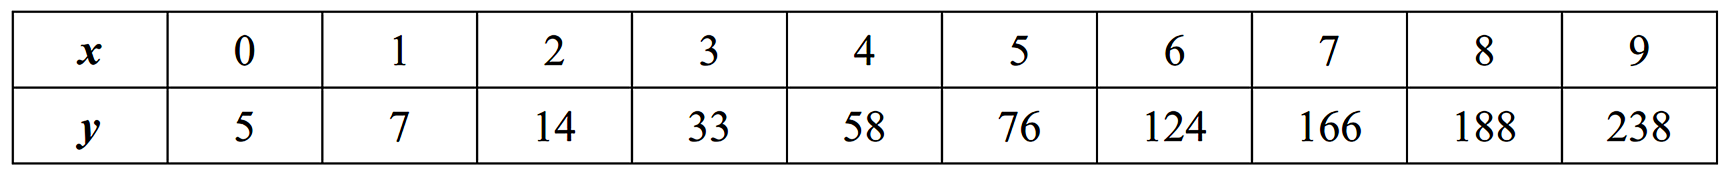
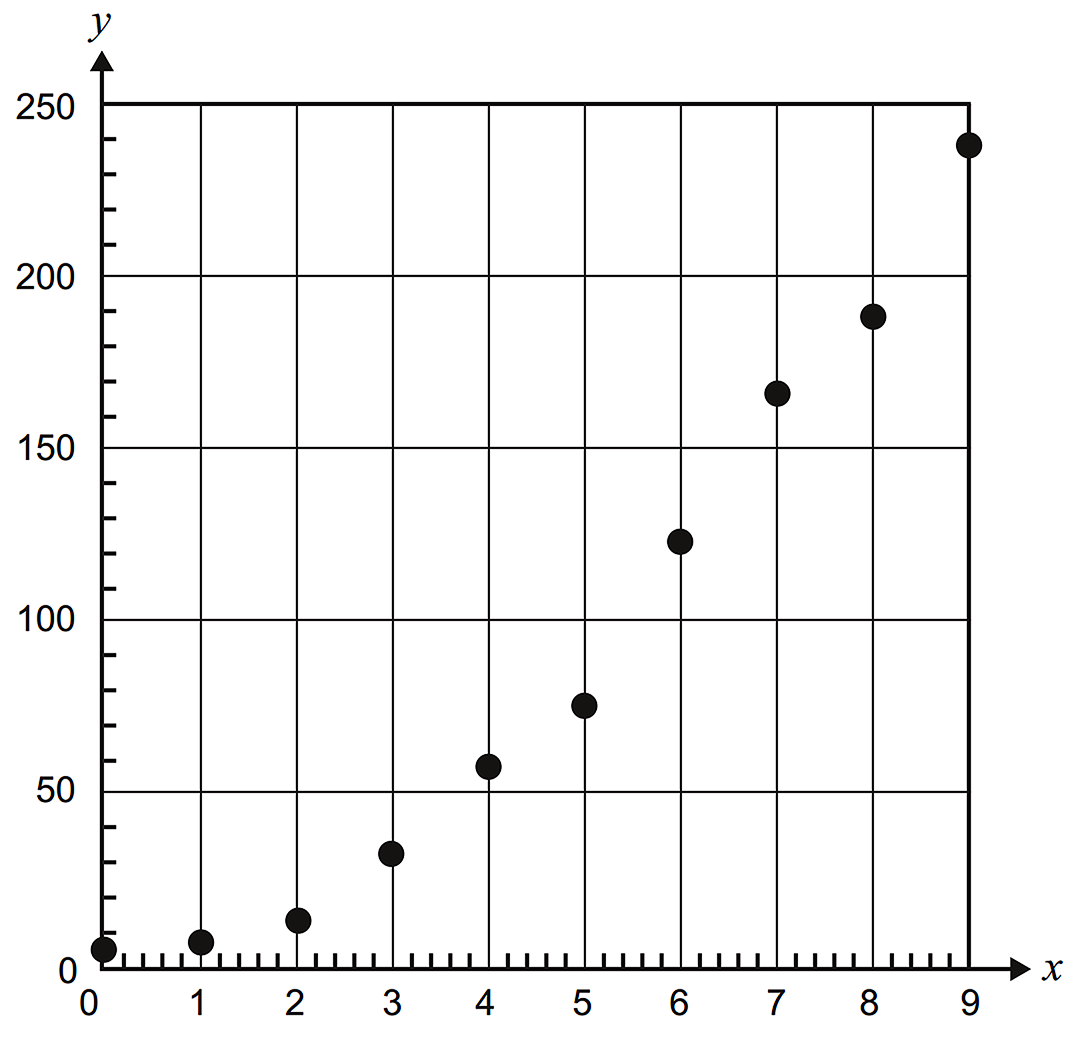
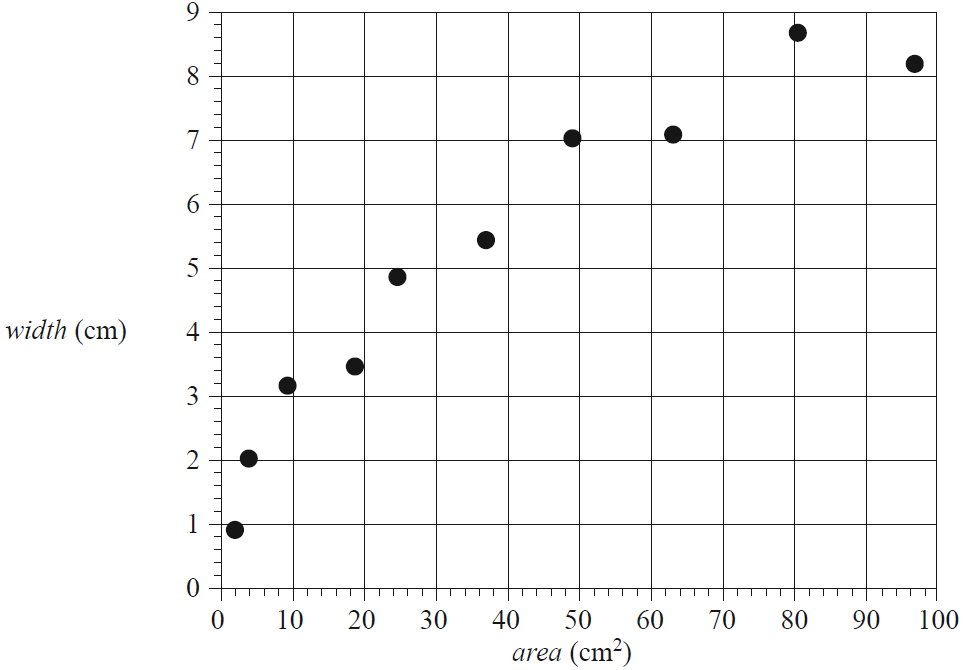
The table below shows the life expectancy in years, life, and the number of doctors per 1000 people, doctors, for a sample of 10 countries in 2024. A scatterplot displaying the data is also shown.

Part 1
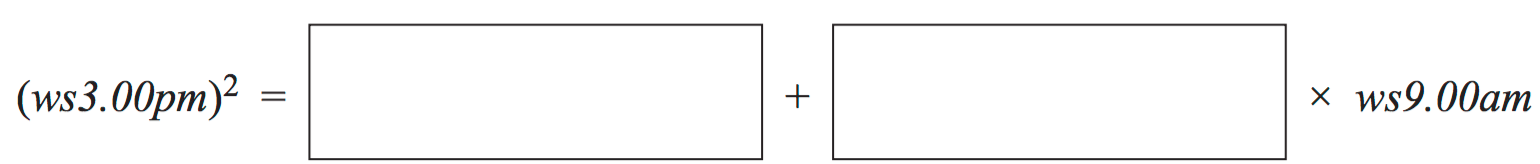
A logarithmic (base 10) transformation was applied to the variable life.
With \(\log _{10}(\textit{life})\) as the response variable, the equation of the least squares line fitted to the transformed data is closest to
- \(\log _{10}(life)=1.57+0.0123 \times doctors\)
- \(\log _{10}(life)=1.63+0.0326 \times doctors\)
- \(\log _{10}(life)=1.79+0.0383 \times doctors\)
- \(\log _{10}(life)=1.85+0.0403 \times doctors\)
Part 2
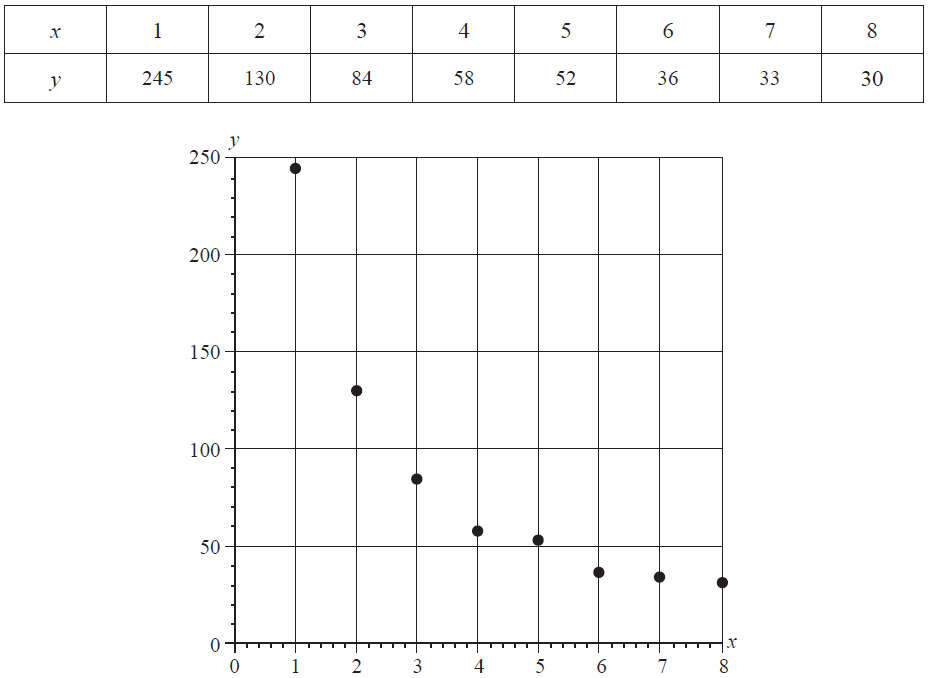
A squared transformation was applied to the variable \(doctors\).
The equation of the least squares line fitted to this transformed data is of the form \(\textit{life}=a+b \times(\textit{doctors})^2\).
Using this equation, the predicted \(life\), in years, for a country with two \(doctors\) per 1000 people is closest to
- 73.6
- 74.0
- 74.5
- 74.9