Part of the graph of \(f:[-\pi, \pi] \rightarrow R, f(x)=x \sin (x)\) is shown below. --- 8 WORK AREA LINES (style=lined) --- --- 3 WORK AREA LINES (style=lined) --- --- 3 WORK AREA LINES (style=lined) --- --- 3 WORK AREA LINES (style=lined) --- --- 0 WORK AREA LINES (style=lined) --- a. \(\dfrac{\sqrt{3}\pi^2}{6}\) bi. \(x\cos(x)+\sin(x)\) bii. \(\left[-\dfrac{\pi}{3}+\dfrac{\sqrt{3}}{3},\ 1\right]\) biii. \(\text{In the interval }\left[\dfrac{\pi}{2}, \dfrac{2\pi}{3}\right],\ f^{\prime}(x)\ \text{changes from positive to negative.}\) \(f^{\prime}(x)=0\ \text{at some point in the interval.}\) \(\therefore\ \text{A stationary point must exist in the given range.}\) b.ii. \(\text{Gradient in given range gradually decreases.}\) \(\text{Range of}\ f^{\prime}(x)\ \text{will be defined by the endpoints.}\) \(f^{\prime}(x)=0\ \text{at some point in the interval.}\) \(\therefore\ \text{A stationary point must exist in the given range.}\) \(f^{\prime}(-\pi)=-\pi\cos(-\pi)+\sin(-\pi)=\pi\) \(\therefore\ \text{Endpoints are }\ (-\pi,\ \pi)\ \text{and}\ (\pi,\ -\pi).\)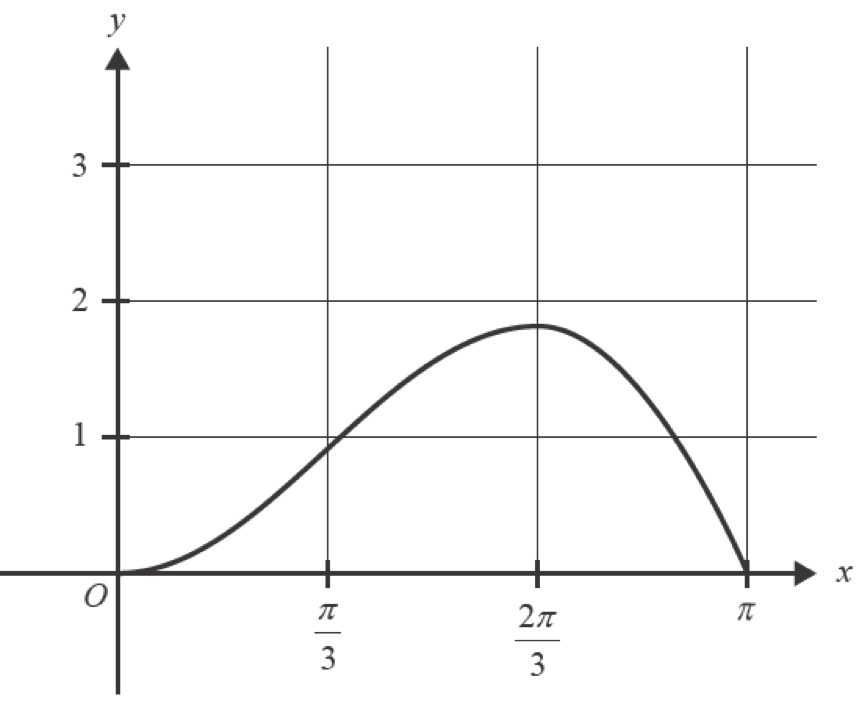


a.
\(A\)
\(=\dfrac{\pi}{3}\times\dfrac{1}{2}\left(f(0)+2f\left(\dfrac{\pi}{3}\right)+2f\left(\dfrac{2\pi}{3}\right)+f(\pi)\right)\)
\(=\dfrac{\pi}{6}\left(0+2\times \dfrac{\pi}{3}\sin\left(\dfrac{\pi}{3}\right)+2\times \dfrac{2\pi}{3}\sin\left(\dfrac{2\pi}{3}\right)+\pi\sin({\pi})\right)\)
\(=\dfrac{\pi}{6}\left(2\times \dfrac{\pi}{3}\times\dfrac{\sqrt{3}}{2}+2\times\dfrac{2\pi}{3}\times \dfrac{\sqrt{3}}{2}+0\right)\)
\(=\dfrac{\pi}{6}\left(\dfrac{2\pi\sqrt{3}}{6}+\dfrac{4\pi\sqrt{3}}{6}\right)\)
\(=\dfrac{\pi}{6}\times \dfrac{6\pi\sqrt{3}}{6}\)
\(=\dfrac{\sqrt{3}\pi^2}{6}\)
bi.
\(f(x)\)
\(=x\sin(x)\)
\(f^{\prime}(x)\)
\(=x\cos(x)+\sin(x)\)
\(f^{\prime}\left(\dfrac{\pi}{2}\right)\)
\(=1\)
\(f^{\prime}\left(\dfrac{2\pi}{3}\right)\)
\(=\dfrac{2\pi}{3}\left(\dfrac{-1}{2}+\dfrac{\sqrt{3}}{2}\right)=-\dfrac{\pi}{3}+\dfrac{\sqrt{3}}{3}\)
\(\therefore\ \text{Range of }\ f^{\prime} (x)\ \text{is}\quad\left[-\dfrac{\pi}{3}+\dfrac{\sqrt{3}}{3},\ 1\right]\)
♦♦♦ Mean mark (b.iii.) 12%.
biii. \(\text{In the interval }\left[\dfrac{\pi}{2}, \dfrac{2\pi}{3}\right],\ f^{\prime}(x)\ \text{changes from positive to negative.}\)
c. \(f^{\prime}(\pi)=\pi\cos(\pi)+\sin(\pi)=-\pi\)
Calculus, MET2 2024 VCAA 13 MC
The function \(f:(0, \infty) \rightarrow R, f(x)=\dfrac{x}{2}+\dfrac{2}{x}\) is mapped to the function \(g\) with the following sequence of transformations:
- dilation by a factor of 3 from the \(y\)-axis
- translation by 1 unit in the negative direction of the \(y\)-axis.
The function \(g\) has a local minimum at the point with the coordinates
- \((6,1)\)
- \(\left(\dfrac{2}{3}, 1\right)\)
- \((2,5)\)
- \(\left(2,-\dfrac{1}{3}\right)\)
Show Worked Solution
\(\text{Dilate by a factor of 3 from the}\ y\text{-axis:}\)
\(f(x) \rightarrow f_1(x)=\dfrac{\frac{x}{3}}{2}+\dfrac{2}{\frac{x}{3}}=\dfrac{x}{6}+\dfrac{6}{x}\)
\(\text{Translate 1 unit down:}\)
\(f_1(x) \rightarrow g(x)=\dfrac{x}{6}+\dfrac{6}{x}-1\)
\(g'(x)=\dfrac{1}{6}-6x^{-2}\)
♦ Mean mark 45%.

\(\Rightarrow A\)
Calculus, MET2 2022 VCAA 7 MC
The graph of `y=f(x)` is shown below.

The graph of `y=f^{\prime}(x)`, the first derivative of `f(x)` with respect to `x` could be


Show Worked Solution

`=>E`
Calculus, MET2 2021 VCAA 8 MC
The graph of the function `f` is shown below.

The graph corresponding to `f^{′}` is


Calculus, MET2 2019 VCAA 16 MC
Part of the graph of `y = f(x)` is shown below.

The corresponding part of the graph of `y = f^{\prime}(x)` is best represented by
| A. |  |
B. |  |
| C. |  |
D. |  |
| E. |  |
Calculus, MET2 2008 VCAA 19 MC
The graph of a function `f` is shown below.

The graph of an antiderivative of `f` could be


Calculus, MET2 2016 VCAA 3 MC
Part of the graph `y = f(x)` of the polynomial function `f` is shown below

`f prime (x) < 0` for
- `x ∈ (−2, 0) uu (1/3, oo)`
- `x ∈ (−9, 100/27)`
- `x ∈ (−oo, −2) uu (1/3, oo)`
- `x ∈ (−2, 1/3)`
- `x ∈ (−oo, −2] uu (1, oo)`
Show Worked Solution
`text(Outlining the sections of negative gradient:)`

`f prime (x) < 0`
`=> C`
Calculus, MET2 2011 VCAA 9 MC
The graph of the function `y = f(x)` is shown below.

Which if the following could be the graph of the derivative function `y = f′(x)`?


Calculus, MET1 2007 VCAA 3
The diagram shows the graph of a function with domain `R`.

- For the graph shown above, sketch on the same set of axes the graph of the derivative function. (3 marks)
--- 3 WORK AREA LINES (style=lined) ---
- Write down the domain of the derivative function. (1 mark)
--- 2 WORK AREA LINES (style=lined) ---
Show Answers Only
-
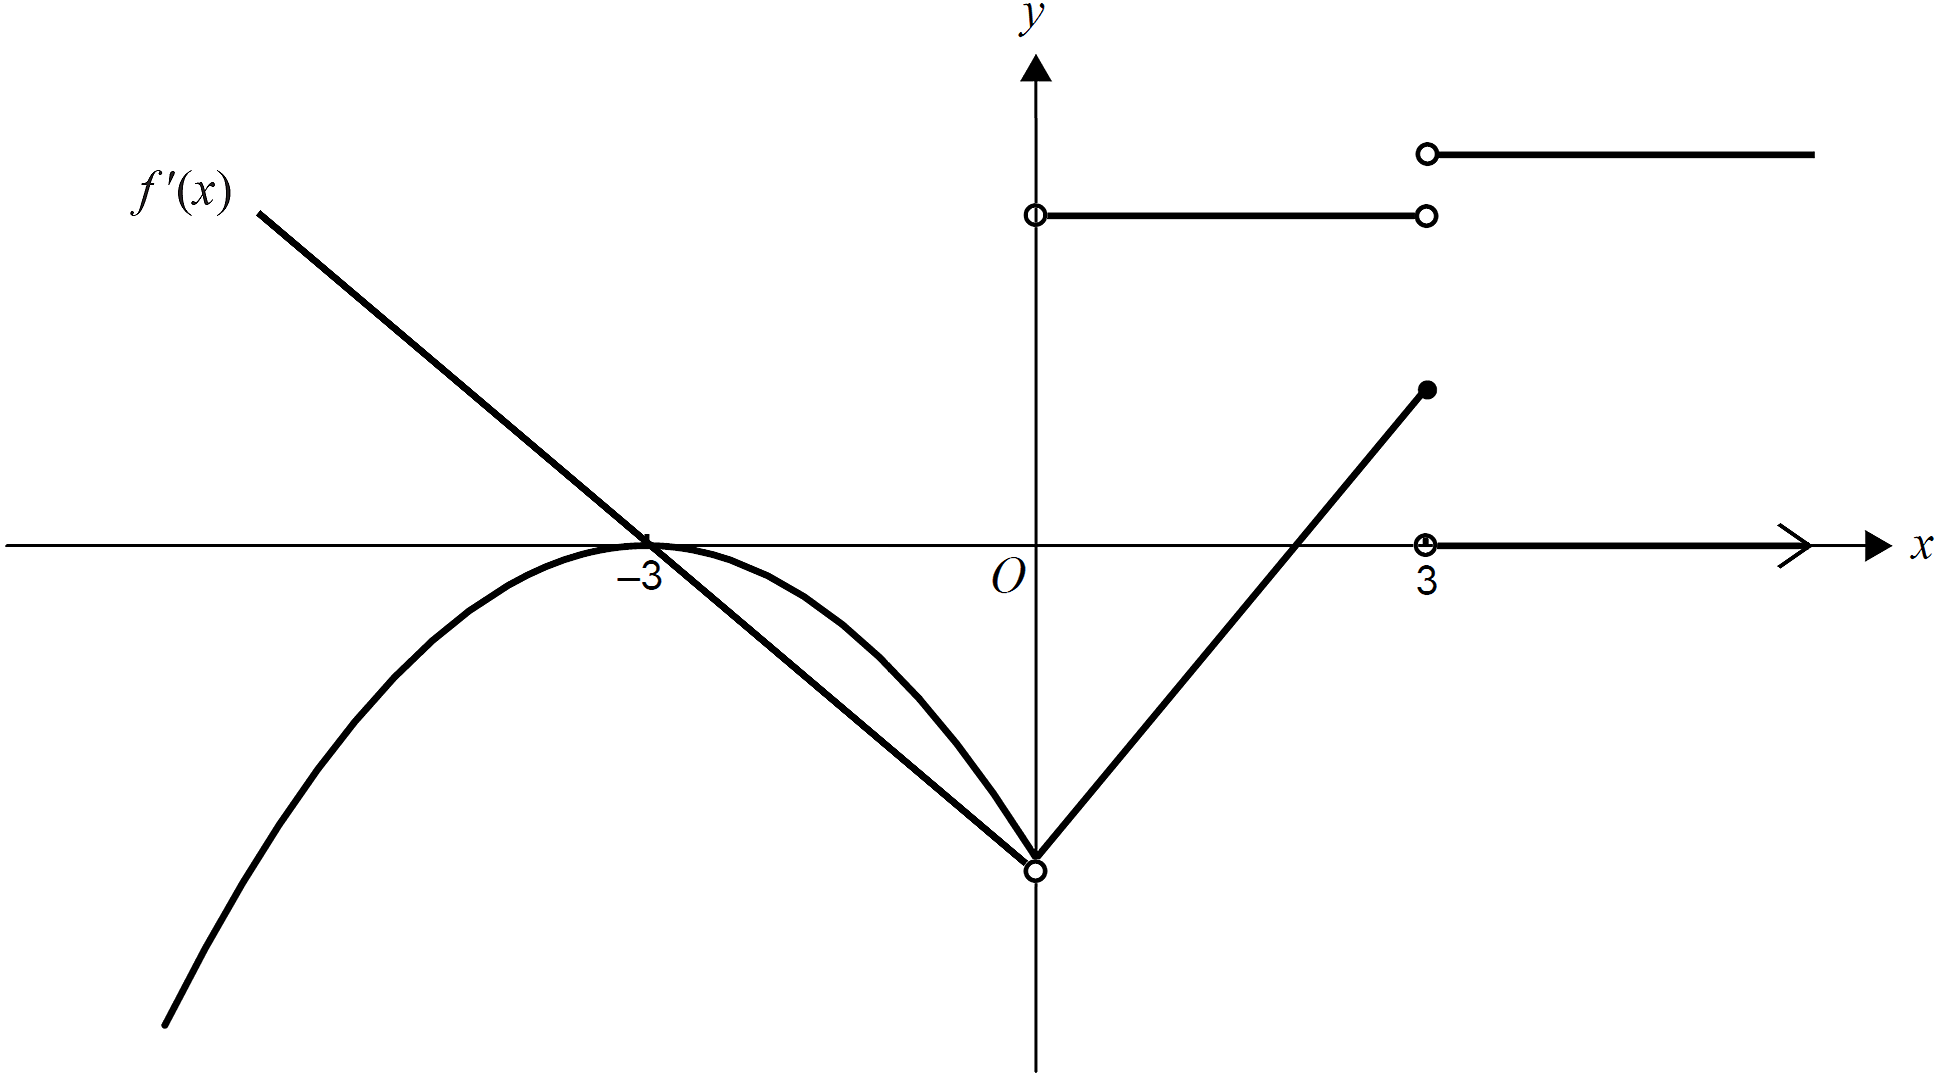
- `R\ text(\)\ {0,3}`
Show Worked Solution
| a. |  |
♦ Part (a) mean mark 42%, and part (b) mean mark 45%.
b. `text(Derivative does not exist at either sharp)`
`text(points or discontinuous points.)`
`:. R\ text(\)\ {0,3}`