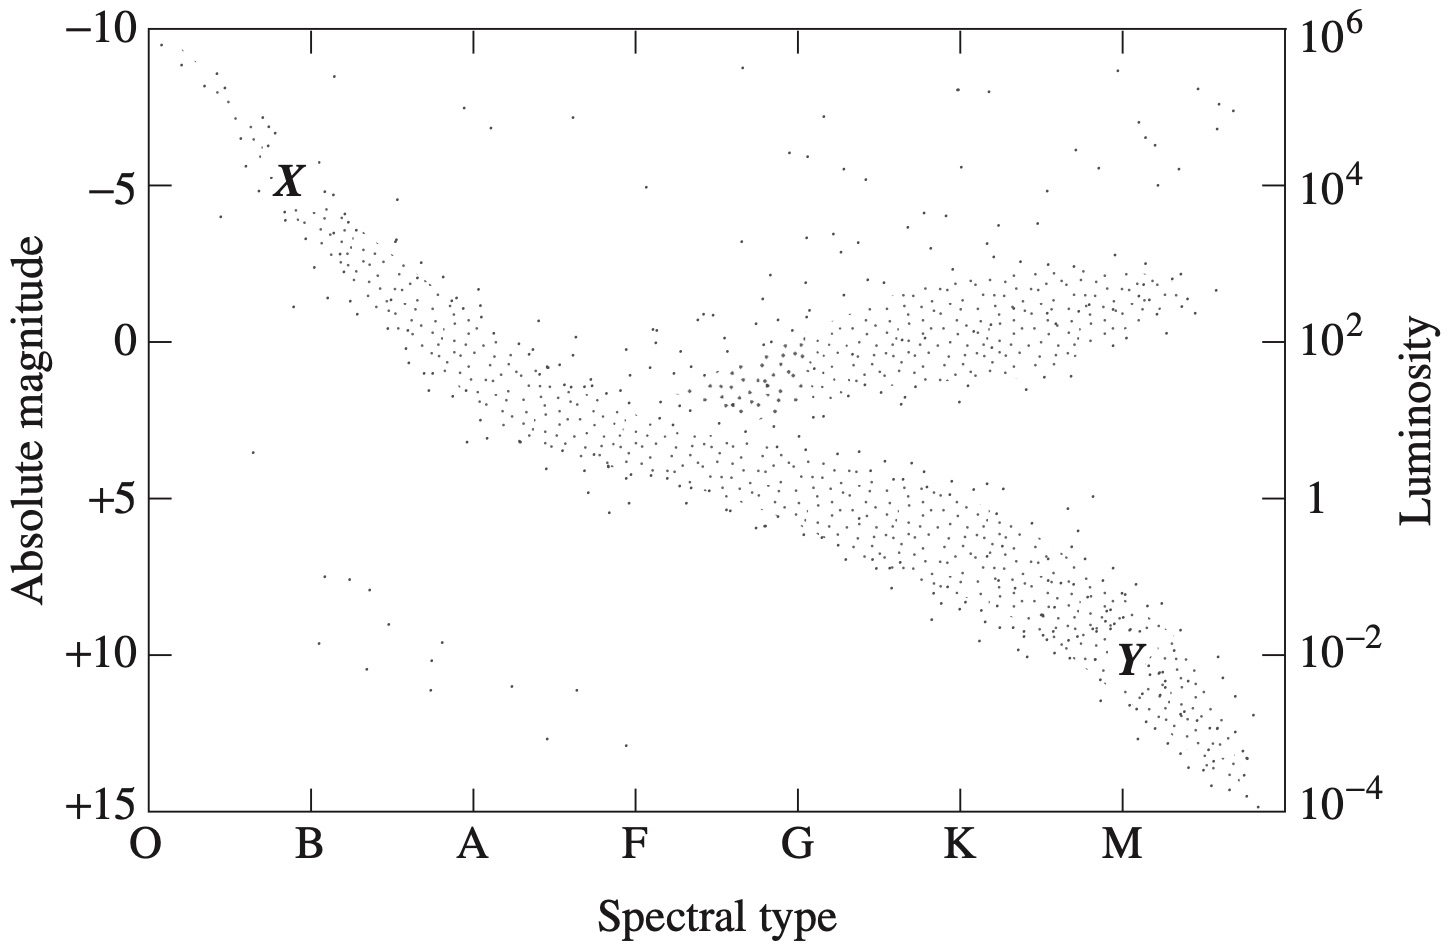
A star cluster is a group of stars that form at the same time. Hertzsprung-Russell diagrams for three star clusters, \(X, Y\) and \(Z\) are shown.
Which row of the table correctly shows the three star clusters from youngest to oldest?
Aussie Maths & Science Teachers: Save your time with SmarterEd
A star cluster is a group of stars that form at the same time. Hertzsprung-Russell diagrams for three star clusters, \(X, Y\) and \(Z\) are shown.
Which row of the table correctly shows the three star clusters from youngest to oldest?
\(A\)
\(\Rightarrow A\)
A Hertzsprung–Russell diagram is shown. --- 4 WORK AREA LINES (style=lined) --- --- 6 WORK AREA LINES (style=lined) --- a. Luminosity determinants: Other variables could include: b. Differences: Other differences could include: a. Luminosity determinants: Other variables could include: b. Differences: Other differences could include:
The Hertzsprung-Russell diagram shown is used to classify stars.
Stars in region `S` of the diagram are much dimmer than other stars in the same spectral class.
What property of the stars in region `S` explains their relatively low luminosity?
`C`
By elimination:
`=>C`
A Hertzsprung-Russell diagram is shown.
In which region would a star have the same surface temperature as a star on the main sequence?
`D`
`=>D`
The position of the Sun, star `W` and star `Z` are shown on the H-R diagram.
The curves `A` and `B` show intensity versus frequency for star `W` and the Sun, measured from the same distance.
--- 4 WORK AREA LINES (style=lined) ---
--- 6 WORK AREA LINES (style=lined) ---
i. Curve A represents star `W`:
ii. Differences displayed in H-R graph:
Other possible answers could include:
i. Curve A represents star `W`:
ii. Differences displayed in H-R graph:
Other possible answers could include:
Describe how the distribution of stars on a Hertzsprung-Russell diagram relates to the processes that occur during their evolution. (6 marks)
--- 12 WORK AREA LINES (style=lined) ---
Other possible answers could include:
The diagram shows the positions of stars `X` and `Y` on a H-R diagram.

Outline the differences in the spectra of stars `X` and `Y`. (2 marks)
A H–R diagram is shown. Star `X` is a main sequence star of 12 solar masses.

Describe how star `X` will change physically and chemically as it continues to evolve. (4 marks)
--- 8 WORK AREA LINES (style=lined) ---
The positions of two stars, `X` and `Y`, are shown in the Hertzsprung-Russell diagram.
--- 4 WORK AREA LINES (style=lined) ---
a. Surface Temperature:
Luminosity:
b. Elements undergoing fusion:
a. Surface Temperature:
Luminosity:
b. Elements undergoing fusion:
Four stars, `P`, `Q`, `R` and `S`, are labelled on the Hertzsprung-Russell diagram.
Which statement is correct?
`C`
`=>C`
The Hertzsprung-Russell diagram shows characteristics of stars in a globular cluster 100 light years in diameter and 27 000 light years from Earth.
The stars plotted on this Hertzsprung-Russell diagram have approximately the same
`A`
`=> A`