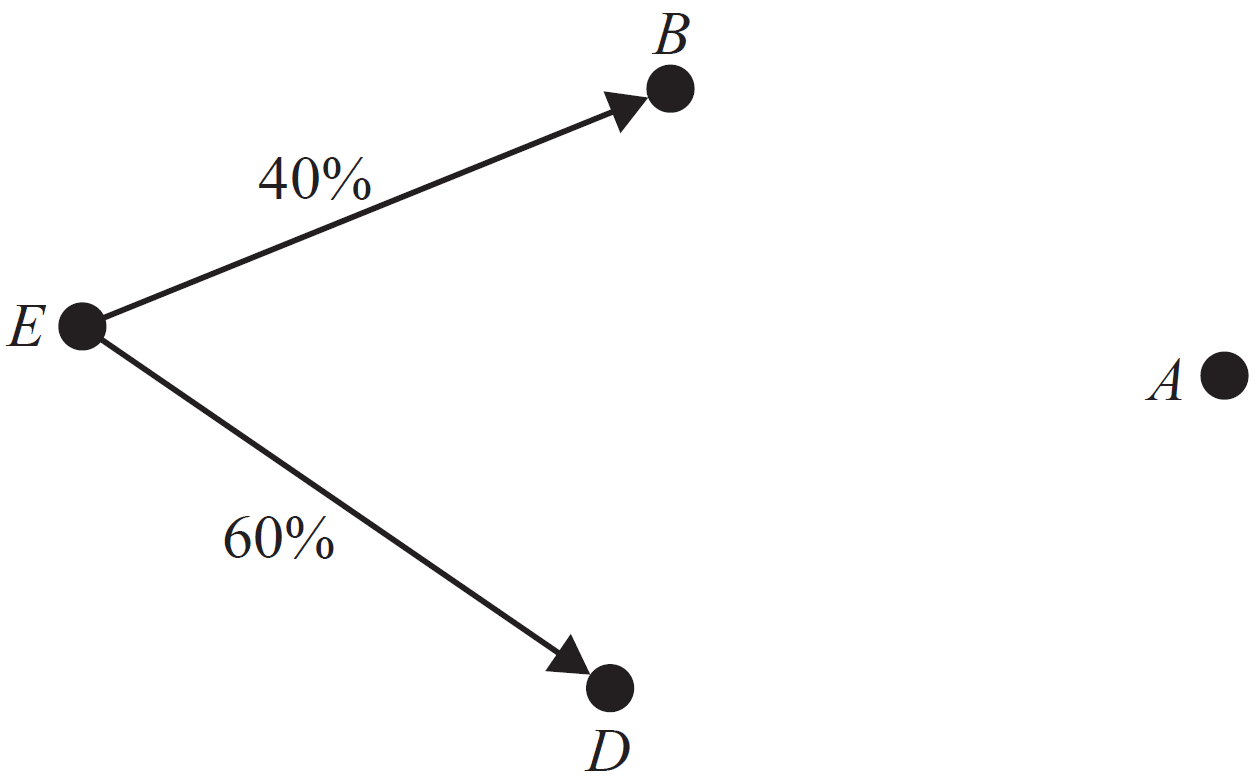
When the construction company established the construction site at the beginning of 2023, it employed 390 staff to work on the site. The staff comprised 330 construction workers \((C)\), 50 foremen \((F)\) and 10 managers \((M)\). At the beginning of each year, staff can choose to stay in the same job, move to a different job on the site, or leave the site \((L)\) and not return. The transition diagram below shows the proportion of staff who are expected to change their job at the site each year. This situation can be modelled by the recurrence relation \(S_{n+1}=T S_n\), where \(T\) is the transitional matrix, \(S_0=\left[\begin{array}{c}330 \\ 50 \\ 10 \\ 0\end{array}\right] \begin{aligned} & C \\ & F \\ & M \\ & L \end{aligned}\) and \(n\) is the number of years after 2023. --- 4 WORK AREA LINES (style=lined) --- --- 2 WORK AREA LINES (style=lined) --- To encourage more construction workers \((C)\) to stay, the construction company has given workers an incentive to move into the job of foreman \((F)\). Matrix \(R\) below shows the ways in which staff are expected to change their jobs from year to year with this new incentive in place. \begin{aligned} The site always requires at least 330 construction workers. To ensure that this happens, the company hires an additional 190 construction workers \((C)\) at the beginning of 2024 and each year thereafter. The matrix \(V_{n+1}\) will then be given by \(V_{n+1}=R V_n+Z\), where \(V_0=\left[\begin{array}{c}330 \\ 50 \\ 10 \\ 0\end{array}\right] \begin{aligned} & C \\ & F \\ & M \\ & L\end{aligned} \quad\quad\quad Z=\left[\begin{array}{c}190 \\ 0 \\ 0 \\ 0\end{array}\right] \begin{aligned} & C \\ & F \\ & M \\ & L\end{aligned} \ \ \) and \(n\) is the number of years after 2023. --- 4 WORK AREA LINES (style=lined) --- --- 4 WORK AREA LINES (style=lined) ---

& \quad \quad \ \ \textit{this year} \\
& \quad C \quad \ \ F \quad \ \ M \quad L\\
R = & \begin{bmatrix}
0.4 & 0.2 & 0 & 0 \\
0.4 & 0.2 & 0.4 & 0 \\
0 & 0.2 & 0.3 & 0 \\
0.2 & 0.4 & 0.3 & 1
\end{bmatrix}\begin{array}{l}
C\\
F\\
M\\
L
\end{array} \quad \textit{next year}
\end{aligned}
Matrices, GEN1 2023 VCAA 32 MC
For one particular week in a school year, students at Phyllis Island Primary School can spend their lunch break at the playground \((P)\), basketball courts \((B)\), oval \((O)\) or the library \((L)\).
Students stay at the same location for the entire lunch break.
The transition diagram below shows the proportion of students who change location from one day to the next.

The transition diagram is incomplete.
On the Monday, 150 students spent their lunch break at the playground, 50 students spent it at the basketball courts, 220 students spent it at the oval, and 40 students spent it in the library.
Of the students expected to spend their lunch break on the oval on the Wednesday, the percentage of these students who also spent their lunch break on the oval on Tuesday is closest to
- 27%
- 30%
- 33%
- 47%
- 52%
MATRICES, FUR1 2021 VCAA 6 MC
A fitness centre offers four different exercise classes: aerobics `(A)`, boxfit `(B)`, cardio `(C)` and dance `(D)`.
A customer's choice of fitness class is expected to change from week to week according to the transition matrix `P`, shown below.
`qquadqquadqquadqquadqquadqquad text(this week)`
`P = {:(qquad\ A quadquadqquad \ B quadquad \ C quadqquad \ D),([(0.65,0, 0.20, 0.10),(0,0.65,0.10,0.30),(0.20,0.10,0.70,0),(0.15,0.25,0,0.60)]{:(A),(B),(C),(D):} qquad text(next week)):}`
An equivalent transition diagram has been constructed below, but the labeling is not complete.

The proportion for one of the transitions is labelled `w`.
The value of `w` is
- 10%
- 15%
- 20%
- 25%
- 30%
Show Worked Solution

`text{The 25% edge label must be} \ B \ text{(this week) to} \ D \ text{(next week)}`
`text{No edge exists between} \ C \ text{and} \ D`
`=> \ text{top left vertex is} \ C \ text{and top right vertex is} \ A.`
| `w` | `= A \ text{this week,} \ D \ text{next week}` |
| `= 0.15` |
`=> B`
MATRICES, FUR2-NHT 2019 VCAA 2
Three television channels, `C_1, C_2` and `C_3`, will broadcast the International Games in Gillen.
Gillen’s 2000 residents are expected to change television channels from hour to hour as shown in the transition matrix `T` below.
The option for residents not to watch television (NoTV) at that time is also indicated in the transition matrix.
`{:(qquadqquadqquadqquadqquadquadtext(this hour)),(qquadqquadqquad \ C_1 quadquad \ C_2 quadqquad C_3 quad \ NoTV),(T = [(0.50,0.05,0.10,0.20),(0.10,0.60,0.20,0.20),(0.25,0.10,0.50,0.10),(0.15,0.25,0.20,0.50)]{:(C_1),(C_2),(C_3),(NoTV):}text(next hour)):}`
The state matrix `G_0` below lists the number of Gillen residents who are expected to watch the games on each of the channels at the start of a particular day (9.00 am).
Also shown is the number of Gillen residents who are not expected to watch television at that time.
`G_0 = [(100), (400), (100), (1400)]{:(C_1), (C_2), (C_3), (NoTV):}`
- Complete the calculation below to show that 835 Gillen residents are not expected to watch television (NoTV) at 10.00 am that day. (1 mark)
--- 0 WORK AREA LINES (style=lined) ---
|
|
`xx 100 +` |
|
`xx 400 +` |
|
`xx 100 ` |
| `+\ \ ` |
|
`xx 1400 ` | `= 835` |
- Determine the number of residents expected to watch the games on `C_3` at 11.00 am that day. (1 mark)
--- 3 WORK AREA LINES (style=lined) ---
MATRICES, FUR2 2019 VCAA 2
The theme park has four locations, Air World `(A)`, Food World `(F)`, Ground World `(G)` and Water World `(W)`.
The number of visitors at each of the four locations is counted every hour.
By 10 am on Saturday the park had reached its capacity of 2000 visitors and could take no more visitors.
The park stayed at capacity until the end of the day
The state matrix, `S_0`, below, shows the number of visitors at each location at 10 am on Saturday.
`S_0 = [(600), (600), (400), (400)] {:(A),(F),(G),(W):}`
- What percentage of the park’s visitors were at Water World `(W)` at 10 am on Saturday? (1 mark)
--- 2 WORK AREA LINES (style=lined) ---
Let `S_n` be the state matrix that shows the number of visitors expected at each location `n` hours after 10 am on Saturday.
The number of visitors expected at each location `n` hours after 10 am on Saturday can be determined by the matrix recurrence relation below.
`{:(qquad qquadqquadqquadqquadqquadqquadqquadqquadqquadqquadqquadqquadqquadqquadqquadqquadqquadqquadqquadqquadqquadqquad text( this hour)),(qquadqquadqquadqquadqquadqquadqquadqquadqquadqquadqquadqquadqquadqquadqquadqquadqquadqquadqquad qquad qquad quad A qquad quad F qquad \ G \ quad quad W),({:S_0 = [(600), (600), (400), (400)], qquad S_(n+1) = T xx S_n quad quad qquad text(where):}\ T = [(0.1,0.2,0.1,0.2),(0.3,0.4,0.6,0.3),(0.1,0.2,0.2,0.1),(0.5,0.2,0.1,0.4)]{:(A),(F),(G),(W):}\ text(next hour)):}`
- Complete the state matrix, `S_1`, below to show the number of visitors expected at each location at 11 am on Saturday. (1 mark)
--- 0 WORK AREA LINES (style=lined) ---
`S_1 = [(\ text{______}\ ), (\ text{______}\ ), (300),(\ text{______}\ )]{:(A),(F),(G),(W):}`
- Of the 300 visitors expected at Ground World `(G)` at 11 am, what percentage was at either Air World `(A)` or Food World `(F)` at 10 am? (1 mark)
--- 3 WORK AREA LINES (style=lined) ---
- The proportion of visitors moving from one location to another each hour on Sunday is different from Saturday.
Matrix `V`, below, shows the proportion of visitors moving from one location to another each hour after 10 am on Sunday.
`qquad qquad {:(qquadqquadqquadqquadqquadtext(this hour)),(qquad qquad qquad \ A qquad quad F qquad \ G \ quad quad W),(V = [(0.3,0.4,0.6,0.3),(0.1,0.2,0.1,0.2),(0.1,0.2,0.2,0.1),(0.5,0.2,0.1,0.4)]{:(A),(F),(G),(W):}\ text(next hour)):}`
Matrix `V` is similar to matrix `T` but has the first two rows of matrix `T` interchanged. - The matrix product that will generate matrix `V` from matrix `T` is
- `qquad qquad V = M xx T`
- where matrix `M` is a binary matrix.
- Write down matrix `M`. (1 mark)
--- 4 WORK AREA LINES (style=lined) ---
MATRICES, FUR1 2018 VCAA 6 MC
A transition matrix, `V`, is shown below.
`{:(),(),(),(),(V =),(),():}{:(qquadqquadtext(this month)),(qquadLqquadquadTqquadquadFqquad\ M),([(0.6,0.6,0.6,0.0),(0.1,0.2,0.0,0.1),(0.3,0.0,0.8,0.4),(0.0,0.2,0.0,0.5)]):}{:(),(),(L),(T),(F),(M):}{:\ text(next month):}`
The transition diagram below has been constructed from the transition matrix `V`.
The labelling in the transition diagram is not yet complete.

The proportion for one of the transitions is labelled `x`.
The value of `x` is
- 0.2
- 0.5
- 0.6
- 0.7
- 0.8
Show Worked Solution

`x = 0.6`
`=> C`
MATRICES, FUR2 2018 VCAA 3
The Hiroads company has a contract to maintain and improve 2700 km of highway.
Each year sections of highway must be graded `(G)`, resurfaced `(R)` or sealed `(S)`.
The remaining highway will need no maintenance `(N)` that year.
Let `S_n` be the state matrix that shows the highway maintenance schedule for the `n`th year after 2018.
The maintenance schedule for 2018 is shown in matrix `S_0` below.
`S_0 = [(700),(400),(200),(1400)]{:(G),(R),(S),(N):}`
The type of maintenance in sections of highway varies from year to year, as shown in the transition matrix `T`, below.
`{:(qquad qquad qquad qquad qquad quad text(this year)),(qquad qquad quad quad G qquad quad R qquad quad S quad quad \ N),(T = [(0.2,0.1,0.0,0.2),(0.1,0.1,0.0,0.2),(0.2,0.1,0.2,0.1),(0.5, 0.7,0.8,0.5)]{:(G),(R),(S),(N):} \ text (next year)):}`
- Of the length of highway that was graded `(G)` in 2018, how many kilometres are expected to be resurfaced `(R)` the following year? (1 mark)
--- 2 WORK AREA LINES (style=lined) ---
- Show that the length of highway that is to be graded `(G)` in 2019 is 460 km by writing the appropriate numbers in the boxes below. (1 mark)
--- 0 WORK AREA LINES (style=lined) ---
|
|
`× 700 +` |
|
`× 400 +` |
|
`× 200 +` |
|
`× 1400 = 460` |
The state matrix describing the highway maintenance schedule for the nth year after 2018 is given by
`S_(n + 1) = TS_n`
- Complete the state matrix, `S_1`, below for the highway maintenance schedule for 2019 (one year after 2018). (1 mark)
--- 0 WORK AREA LINES (style=lined) ---
`qquad qquad S_1 = [(460),(text{____}),(text{____}),(1490)]{:(G),(R),(S),(N):}`
- In 2020, 1536 km of highway is expected to require no maintenance `(N)`
- Of these kilometres, what percentage is expected to have had no maintenance `(N)` in 2019?
- Round your answer to one decimal place. (1 mark)
--- 3 WORK AREA LINES (style=lined) ---
- In the long term, what percentage of highway each year is expected to have no maintenance `(N)`?
- Round your answer to one decimal place. (1 mark)
--- 4 WORK AREA LINES (style=lined) ---
MATRICES, FUR2 2017 VCAA 3
Senior students at a school choose one elective activity in each of the four terms in 2018.
Their choices are communication (`C`), investigation (`I`), problem-solving (`P`) and service (`S`).
The transition matrix `T` shows the way in which senior students are expected to change their choice of elective activity from term to term.
`{:(qquadqquadqquadqquadquadtext(this term)),(qquadqquadqquad\ CqquadquadIqquadquadPqquad\ S),(T = [(0.4,0.2,0.3,0.1),(0.2,0.4,0.1,0.3),(0.2,0.3,0.3,0.4),(0.2,0.1,0.3,0.2)]{:(C),(I),(P),(S):}qquadtext(next term)):}`
Let `S_n` be the state matrix for the number of senior students expected to choose each elective activity in Term `n`.
For the given matrix `S_1`, a matrix rule that can be used to predict the number of senior students in each elective activity in Terms 2, 3 and 4 is
`S_1 = [(300),(200),(200),(300)],qquadS_(n + 1) = TS_n`
- How many senior students will not change their elective activity from Term 1 to Term 2? (1 mark)
--- 2 WORK AREA LINES (style=lined) ---
- Complete `S_2`, the state matrix for Term 2, below. (1 mark)
--- 3 WORK AREA LINES (style=lined) ---

- Of the senior students expected to choose investigation (`I`) in Term 3, what percentage chose service (`S`) in Term 2? (2 marks)
--- 5 WORK AREA LINES (style=lined) ---
- What is the maximum number of senior students expected in investigation (`I`) at any time during 2018? (1 mark)
--- 3 WORK AREA LINES (style=lined) ---
MATRICES, FUR2 2007 VCAA 2
To study the life-and-death cycle of an insect population, a number of insect eggs (`E`), juvenile insects (`J`) and adult insects (`A`) are placed in a closed environment. The initial state of this population can be described by the column matrix `S_0 = [(400),(200),(100),(0)]{:(E),(J),(A),(D):}` A row has been included in the state matrix to allow for insects and eggs that die (`D`). --- 1 WORK AREA LINES (style=lined) --- In this population In this population, the adult insects have been sterilised so that no new eggs are produced. In these circumstances, the life-and-death cycle of the insects can be modelled by the transition matrix `{:(qquadqquadqquadqquadquadtext(this week)),((qquadqquadqquadE,quad\ J,quadA,\ D)),(T = [(0.4,0,0,0),(0.5,0.4,0,0),(0,0.5,0.8,0),(0.1,0.1,0.2,1)]{:(E),(J),(A),(D):}):}` --- 1 WORK AREA LINES (style=lined) --- --- 1 WORK AREA LINES (style=lined) --- --- 3 WORK AREA LINES (style=lined) --- --- 1 WORK AREA LINES (style=lined) --- --- 4 WORK AREA LINES (style=lined) --- --- 3 WORK AREA LINES (style=lined) --- --- 3 WORK AREA LINES (style=lined) --- --- 3 WORK AREA LINES (style=lined) ---
MATRICES, FUR2 2013 VCAA 2
10 000 trout eggs, 1000 baby trout and 800 adult trout are placed in a pond to establish a trout population.
In establishing this population
-
- eggs (`E`) may die (`D`) or they may live and eventually become baby trout (`B`)
- baby trout (`B`) may die (`D`) or they may live and eventually become adult trout (`A`)
- adult trout (`A`) may die (`D`) or they may live for a period of time but will eventually die.
From year to year, this situation can be represented by the transition matrix `T`, where
`{:(qquadqquadqquadqquadqquadtext(this year)),((qquadqquadqquadE,quad\ B,quad\ A,\ D)),(T = [(0,0,0,0),(0.4,0,0,0),(0,0.25,0.5,0),(0.6,0.75,0.5,1)]):}{:(),(),(E),(B),(A),(D):}{:(),(),(qquadtext(next year)):}`
- Use the information in the transition matrix `T` to
- determine the number of eggs in this population that die in the first year. (1 mark)
--- 2 WORK AREA LINES (style=lined) ---
- complete the transition diagram below, showing the relevant percentages. (2 marks)
--- 0 WORK AREA LINES (style=lined) ---
- determine the number of eggs in this population that die in the first year. (1 mark)

The initial state matrix for this trout population, `S_0`, can be written as
`S_0 = [(10\ 000),(1000),(800),(0)]{:(E),(B),(A),(D):}`
Let `S_n` represent the state matrix describing the trout population after `n` years.
- Using the rule `S_n = T S_(n-1)`, determine each of the following.
- `S_1` (1 mark)
--- 3 WORK AREA LINES (style=lined) ---
- the number of adult trout predicted to be in the population after four years (1 mark)
--- 3 WORK AREA LINES (style=lined) ---
- `S_1` (1 mark)
- The transition matrix `T` predicts that, in the long term, all of the eggs, baby trout and adult trout will die.
- How many years will it take for all of the adult trout to die (that is, when the number of adult trout in the population is first predicted to be less than one)? (1 mark)
--- 2 WORK AREA LINES (style=lined) ---
- What is the largest number of adult trout that is predicted to be in the pond in any one year? (1 mark)
--- 3 WORK AREA LINES (style=lined) ---
- How many years will it take for all of the adult trout to die (that is, when the number of adult trout in the population is first predicted to be less than one)? (1 mark)
- Determine the number of eggs, baby trout and adult trout that, if added to or removed from the pond at the end of each year, will ensure that the number of eggs, baby trout and adult trout in the population remains constant from year to year. (2 marks)
--- 4 WORK AREA LINES (style=lined) ---
The rule `S_n = T S_(n – 1)` that was used to describe the development of the trout in this pond does not take into account new eggs added to the population when the adult trout begin to breed.
- To take breeding into account, assume that 50% of the adult trout lay 500 eggs each year.
- The matrix describing the population after one year, `S_1`, is now given by the new rule
- `S_1 = T S_0 + 500\ M\ S_0`
- where `T=[(0,0,0,0),(0.40,0,0,0),(0,0.25,0.50,0),(0.60,0.75,0.50,1.0)], M=[(0,0,0.50,0),(0,0,0,0),(0,0,0,0),(0,0,0,0)]\ text(and)\ S_0=[(10\ 000),(1000),(800),(0)]`
- Use this new rule to determine `S_1`. (1 mark)
--- 4 WORK AREA LINES (style=lined) ---
- Use this new rule to determine `S_1`. (1 mark)
- This pattern continues so that the matrix describing the population after `n` years, `S_n`, is given by the rule
- `S_n = T\ S_(n-1) + 500\ M\ S_(n-1)`
- Use this rule to determine the number of eggs in the population after two years (2 marks)
--- 6 WORK AREA LINES (style=lined) ---
- Use this rule to determine the number of eggs in the population after two years (2 marks)
Show Worked Solution
a.i. `text(60% of eggs die in 1st year,)`
`:.\ text(Eggs that die in year 1)`
`= 0.60 xx 10\ 000`
`= 6000`
MARKER’S COMMENT: A 100% cycle drawn at `D` was a common omission. Do not draw loops and edges of 0%!
| a.ii. |
|

| b.i. | `S_1` | `= TS_0` |
| `= [(0,0,0,0),(0.4,0,0,0),(0,0.25,0.5,0),(0.6,0.75,0.5,1)][(10\ 000),(1000),(800),(0)]= [(0),(4000),(650),(7150)]` |
| b.ii. | `S_4` | `= T^4S_0` |
| `= [(0,0,0,0),(0.4,0,0,0),(0,0.25,0.5,0),(0.6,0.75,0.5,1)]^4[(10\ 000),(1000),(800),(0)]= [(0),(0),(331.25),(11\ 468.75)]` |
`:. 331\ text(trout is the predicted population after 4 years.)`
| c.i. | `S_12 = T^12S_0 = [(0),(0),(1.29),(11\ 791)]` |
`S_13 = T^13S_0 = [(0),(0),(0.65),(11\ 799)]`
`:.\ text{It will take 13 years (when the trout population drops below 1).}`
| c.ii. | `S_1 = TS_0 = [(0),(4000),(650),(7150)]` |
`text(After 1 year, 650 adult trout.)`
`text(Similarly,)`
`S_2 = T^2S_0 = [(0),(0),(1325),(10\ 475)]`
`S_3 = T^3S_0 = [(0),(0),(662.5),(11\ 137.5)]`
`S_4 = T^4S_0 = [(0),(0),(331),(11\ 469)]`
`:.\ text(Largest number of adult trout = 1325.)`
| d. | `S_0-S_1 = [(10\ 000),(1000),(800),(0)]-[(0),(4000),(650),(7150)] = [(10\ 000),(−3000),(150),(−7150)]` |
`:.\ text(Add 10 000 eggs, remove 3000 baby trout and add 150 adult)`
`text(trout to keep the population constant.)`
| e.i. | `S_1` | `= TS_0 + 500MS_0` |
| `= [(0),(4000),(650),(7150)] + 500 xx [(0,0,0.5,0),(0,0,0,0),(0,0,0,0),(0,0,0,0)][(10\ 000),(1000),(800),(0)]` | ||
| `= [(0),(4000),(650),(7150)] + 500[(400),(0),(0),(0)]` | ||
| `= [(200\ 000),(4000),(650),(7150)]` |
| e.ii. | `S_2` | `= TS_1 + 500MS_1` |
|
`= [(0,0,0,0),(0.4,0,0,0),(0,0.25,0.5,0),(0.6,0.75,0.5,1)][(200\ 000),(4000),(650),(7150)]` `+ 500 xx [(0,0,0.5,0),(0,0,0,0),(0,0,0,0),(0,0,0,0)][(200\ 000),(4000),(650),(7150)]` |
||
| `= [(162\ 500),(80\ 000),(1325),(130\ 475)]` |
MATRICES, FUR1 2008 VCAA 7-9 MC
A large population of mutton birds migrates each year to a remote island to nest and breed. There are four nesting sites on the island, A, B, C and D.
Researchers suggest that the following transition matrix can be used to predict the number of mutton birds nesting at each of the four sites in subsequent years. An equivalent transition diagram is also given.
| `{:(qquad qquad qquad qquad {:text(this year):}), (qquad qquad quad quad \ {:(A,\ \ B,\ \ C,\ D):}), (T = [(0.4, 0, 0.2, 0),(0.35, 1, 0.15, 0), (0.15, 0, 0.55, 0), (0.1, 0, 0.1, 1)] {:(A), (B), (C), (D):} quad {:text(next year):}):}` |  |
Part 1
Two thousand eight hundred mutton birds nest at site C in 2008.
Of these 2800 mutton birds, the number that nest at site A in 2009 is predicted to be
A. `560`
B. `980`
C. `1680`
D. `2800`
E. `3360`
Part 2
This transition matrix predicts that, in the long term, the mutton birds will
A. nest only at site A.
B. nest only at site B.
C. nest only at site A and C.
D. nest only at site B and D.
E. continue to nest at all four sites.
Part 3
Six thousand mutton birds nest at site B in 2008.
Assume that an equal number of mutton birds nested at each of the four sites in 2007. The same transition matrix applies.
The total number of mutton birds that nested on the island in 2007 was
A. `6000`
B. `8000`
C. `12\ 000`
D. `16\ 000`
E. `24\ 000`
MATRICES, FUR1 2010 VCAA 9 MC
Robbie completed a test of four multiple-choice questions.
Each question had four alternatives, A, B, C or D.
Robbie randomly guessed the answer to the first question.
He then determined his answers to the remaining three questions by following the transition matrix
`{:(qquad qquad qquad {:text(this question):}), (qquad qquad quad \ {:(A, B, C, D):}), (T = [(1,\ 0,\ 0,\ 0), (0,\ 0,\ 1,\ 0), (0,\ 0,\ 0,\ 1), (0,\ 1,\ 0,\ 0)] {:(A), (B), (C), (D):} quad {:text(next question):}):}`
Which of the following statements is true?
A. It is impossible for Robbie to give the same answer to all four questions.
B. Robbie would always give the same answer to the first and fourth questions
C. Robbie would always give the same answer to the second and third questions.
D. If Robbie answered A for question one, he would have answered B for question two
E. It is possible that Robbie gave the same answer to exactly three of the four questions.