A manufacturer \((M)\) makes deliveries to the supermarket \((S)\) via a number of storage warehouses, \(L, N, O, P, Q\) and \(R\). These eight locations are represented as vertices in the network below. The numbers on the edges represent the maximum number of deliveries that can be made between these locations each day. --- 1 WORK AREA LINES (style=lined) --- --- 1 WORK AREA LINES (style=lined) --- --- 0 WORK AREA LINES (style=lined) ---
a. \(13+18+6+9=46\) \(\text{(Reverse flow}\ Q → O\ \text{is not counted.)}\) b. \(\text{Max deliveries (min cut)}\ =13+5+11+8=37\) \(\text{locations R and S.}\)

locations ____ and ____. (1 mark)

c. \(\text{The number of deliveries should be increased between}\)
NETWORKS, FUR2 2020 VCAA 4
Training program 1 has the cricket team starting from exercise station `S` and running to exercise station `O`.
For safety reasons, the cricket coach has placed a restriction on the maximum number of people who can use the tracks in the fitness park.
The directed graph below shows the capacity of the tracks, in number of people per minute.

- How many different routes from `S` to `O` are possible? (1 mark)
--- 2 WORK AREA LINES (style=lined) ---
When considering the possible flow of people through this network, many different cuts can be made.
- Determine the capacity of Cut 1, shown above. (1 mark)
--- 2 WORK AREA LINES (style=lined) ---
- What is the maximum flow from `S` to `O`, in number of people per minute? (1 mark)
--- 3 WORK AREA LINES (style=lined) ---
Show Worked Solution
| a. | `text(Routes: )` | `SMO, STUNO, STUVO, STUVPO, SRQUNO,SRQUVO,` |
| `SRQUVPO, SRQVO, SRQVPO, SRQPO` |
♦♦ Mean mark part (a) 30%.
`:. 10\ text(routes)`
| b. | `text{Capacity (Cut 1)}` | `= 20 + 12 + 20` |
| `= 52` |
c. `text(Max flow/minimum cut)`
♦♦ Mean mark part (c) 32%.
`= 20 + 10 + 20`
`= 50`

NETWORKS, FUR1-NHT 2019 VCAA 4 MC
Which one of the following flow diagrams shows a cut that has a capacity of 19?
| A. |  |
| B. |  |
| C. |  |
| D. |  |
| E. |  |
NETWORKS, FUR1 2019 STD2 40
A museum is planning an exhibition using five rooms.
The museum manager draws a network to help plan the exhibition. The vertices `A`, `B`, `C`, `D` and `E` represent the five rooms. The number on the edges represent the maximum number of people per hour who can pass through the security checkpoints between the rooms.

- What is the capacity of the cut shown? (1 mark)
--- 2 WORK AREA LINES (style=lined) ---
- The museum manager is planning for a maximum of 240 visitors to pass through the exhibition each hour. By using the 'minimum cut-maximum flow' theorem, the manager determines that the plan does not provide sufficient flow capacity.
Draw the minimum cut onto the network below and recommend a change that the manager could make to one or more security checkpoints to increase the flow capacity to 240 visitors per hour. (2 marks)
--- 4 WORK AREA LINES (style=lined) ---

Show Answers Only
- `290`
-

Show Worked Solution
| a. | `text(Capacity)` | `= 130 + 90 + 70` |
| `= 290` |
♦♦ Mean mark 32%.
COMMENT: In part (a), edge BC flows from the exit to the entry and is therefore not counted.
b. `text(Maximum flow capacity:)`
`text(Minimum cut = 80 + 40 + 65 + 45 = 230)`♦♦♦ Mean mark 19%.
COMMENT: In part (b), edge BC now flows from entry to exit in the new “minimum” cut and is counted.
`text(If security is improved to increase the flow)`
`text(between Room C and Room B by 10 visitors)`
`text(per hour, the network’s flow capacity increases)`
`text(to 240.)`
NETWORKS, FUR1 2019 VCAA 3 MC
The flow of water through a series of pipes is shown in the network below
The numbers on the edges show the maximum flow through each pipe in litres per minute.

The capacity of Cut `Q`, in litres per minute, is
- 11
- 13
- 14
- 16
- 17
NETWORKS, FUR2 2018 VCAA 1
The graph below shows the possible number of postal deliveries each day between the Central Mail Depot and the Zenith Post Office.
The unmarked vertices represent other depots in the region.
The weighting of each edge represents the maximum number of deliveries that can be made each day.

- Cut A, shown on the graph, has a capacity of 10.
Two other cuts are labelled as Cut B and Cut C.
i. Write down the capacity of Cut B. (1 mark)
ii. Write down the capacity of Cut C. (1 mark)--- 2 WORK AREA LINES (style=lined) ---
--- 2 WORK AREA LINES (style=lined) ---
- Determine the maximum number of deliveries that can be made each day from the Central Mail Depot to the Zenith Post Office. (1 mark)
--- 2 WORK AREA LINES (style=lined) ---
NETWORKS, FUR1 2008 VCAA 6 MC

For the graph above, the capacity of the cut shown is
A. `33`
B. `36`
C. `40`
D. `42`
E. `46`
NETWORKS, FUR1 2010 VCAA 6-7 MC
In the network below, the values on the edges give the maximum flow possible between each pair of vertices. The arrows show the direction of flow. A cut that separates the source from the sink in the network is also shown.

Part 1
The capacity of this cut is
A. `14`
B. `18`
C. `23`
D. `31`
E. `40`
Part 2
The maximum flow between source and sink through the network is
A. `7`
B. `10`
C. `11`
D. `12`
E. `20`
Show Worked Solution
Part 1
`text(Capacity of the cut)`
♦ Mean mark 50%.
COMMENT: A quarter of students incorrectly included the “8” which is flowing in the opposite direction.
COMMENT: A quarter of students incorrectly included the “8” which is flowing in the opposite direction.
`= 11 + 5 + 7`
`= 23`
`=> C`
Part 2

`text(The maximum flow)`
♦♦♦ Mean mark 24%.
`=\ text{minimum cut (see above)}`
`= 4 + 2 + 3 + 1`
`= 10`
`=> B`
NETWORKS, FUR1 2006 VCAA 6 MC

In the directed graph above the weight of each edge is non-zero.
The capacity of the cut shown is
A. a + b + c + d + e
B. a + c + d + e
C. a + b + c + e
D. a + b + c – d + e
E. a – b + c – d + e
NETWORKS, FUR2 2007 VCAA 3
As an attraction for young children, a miniature railway runs throughout the new housing estate.
The trains travel through stations that are represented by nodes on the directed network diagram below.
The number of seats available for children, between each pair of stations, is indicated beside the corresponding edge.

Cut 1, through the network, is shown in the diagram above.
- Determine the capacity of Cut 1. (1 mark)
--- 3 WORK AREA LINES (style=lined) ---
- Determine the maximum number of seats available for children for a journey that begins at the West Terminal and ends at the East Terminal. (1 mark)
--- 3 WORK AREA LINES (style=lined) ---
On one particular train, 10 children set out from the West Terminal.
No new passengers board the train on the journey to the East Terminal.
- Determine the maximum number of children who can arrive at the East Terminal on this train. (1 mark)
--- 5 WORK AREA LINES (style=lined) ---
Show Worked Solution
a. `text(The capacity of Cut 1)`
♦♦ Mean mark for all parts (combined) was 33%.
MARKER’S COMMENT: A common error was counting the edge with “10” in the reverse direction (it should be ignored).
MARKER’S COMMENT: A common error was counting the edge with “10” in the reverse direction (it should be ignored).
`=14 + 8 + 13 + 8`
`= 43`
| b. |  |
| `text(Maximum seats)` | `=\ text(minimum cut)` |
| `= 6 + 7 + 9` | |
| `= 22` |
c. `text{The path (edge weights) of the train setting out with}`
`text(10 children starts with: 11 → 13.)`
`text(At the next station, a maximum of 7 seats are available)`
`text(which remain until the East Terminal.)`
`:.\ text(Maximum number of children arriving is 7.)`
NETWORKS, FUR2 2013 VCAA 3
The rangers at the wildlife park restrict access to the walking tracks through areas where the animals breed.
The edges on the directed network diagram below represent one-way tracks through the breeding areas. The direction of travel on each track is shown by an arrow. The numbers on the edges indicate the maximum number of people who are permitted to walk along each track each day.

- Starting at `A`, how many people, in total, are permitted to walk to `D` each day? (1 mark)
--- 2 WORK AREA LINES (style=lined) ---
One day, all the available walking tracks will be used by students on a school excursion.
The students will start at `A` and walk in four separate groups to `D`.
Students must remain in the same groups throughout the walk.
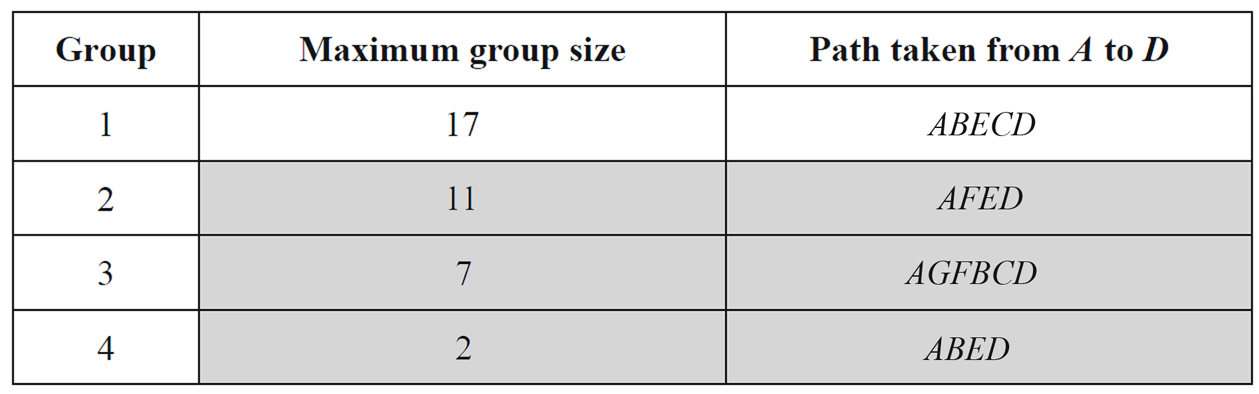
- i. Group 1 will have 17 students. This is the maximum group size that can walk together from `A` to `D`.
Write down the path that group 1 will take. (1 mark)
--- 1 WORK AREA LINES (style=lined) ---
- ii. Groups 2, 3 and 4 will each take different paths from `A` to `D`.
Complete the six missing entries shaded in the table below. (2 marks)
--- 4 WORK AREA LINES (style=lined) ---

Show Answers Only
- `37`
-
- `A-B-E-C-D`
- `text{One possible solution is:}`
Show Worked Solution
| a. | `text(Maximum flow)` | `=\ text(minimum cut through)\ CD and ED` |
| `= 24 + 13` | ||
| `= 37` |
♦ Mean mark of all parts (combined) was 41%.
`:.\ text(A maximum of 37 people can walk)`
`text(to)\ D\ text(from)\ A.`
b.i. `A-B-E-C-D`
b.ii. `text(One solution using the second possible largest)`
`text(group of 11 students and two groups from the)`
`text(remaining 9 students is:)`

NETWORKS, FUR1 2015 VCAA 4 MC
The arrows on the diagram below show the direction of the flow of waste through a series of pipelines from a factory to a waste dump.
The numbers along the edges show the number of megalitres of waste per week that can flow through each section of pipeline.

The minimum cut is shown as a dotted line.
The capacity of this cut, in megalitres of waste per week, is
A. `6`
B. `18`
C. `26`
D. `32`
E. `34`