SmarterEd

Aussie Maths & Science Teachers: Save your time with SmarterEd

  • Login
  • Get Help
  • About

Networks, GEN1 2024 NHT 38-39 MC

The following directed graph represents the one-way paths between attractions at an historical site. The entrance, exit and attractions are represented by vertices.

The numbers on the edges represent the maximum number of visitors allowed along each path per hour.
 

Question 38

What is the maximum number of visitors able to walk from the entrance to the exit each hour?

  1. 75
  2. 76
  3. 77
  4. 88
  5. 96

 
Question 39

A group of students set out from the entrance and walk to the exit. The students all walk together and travel along the same route. They are the only people visiting the site that hour. What is the maximum number of students that could be in the group?

  1. 9
  2. 15
  3. 16
  4. 20
  5. 31
Show Answers Only

\(\text{Question 38:}\ B\)

\(\text{Question 39:}\ D\)

Show Worked Solution

\(\text{Question 38}\)

\(\text{Max flow = min cut}\)

\(\text{Max flow = 13+16+9+17+21=76\)

\(\Rightarrow B\)
  

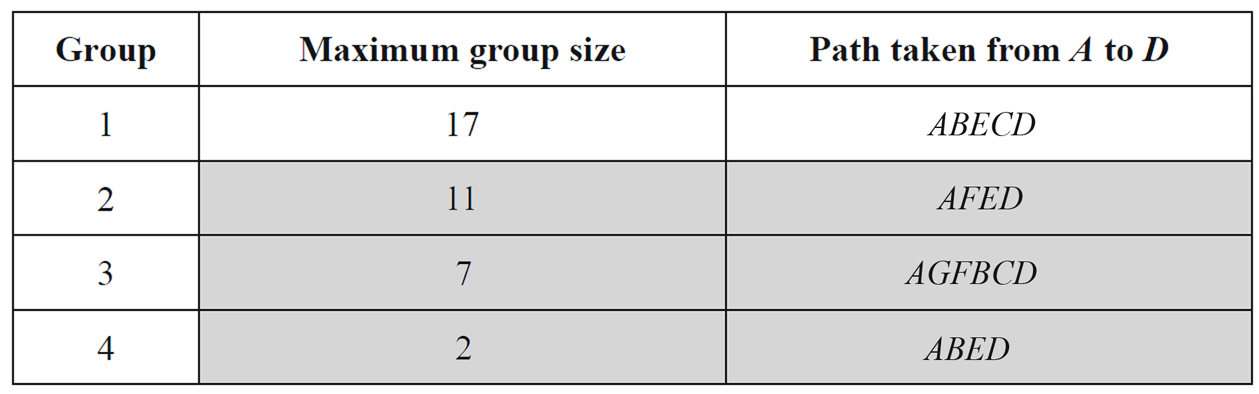
\(\text{Question 39}\)

\(\text{Given all students must take the same route:}\)

\(\text{Path for max students is 32 → 20 → 32 → 21}\)

\(\text{Max students = minimum capacity of any edge = 20}\)

\(\Rightarrow D\)

Filed Under: Flow Problems Tagged With: Band 4, Band 5, smc-625-20-Max Flow/Min Cut

Networks, GEN1 2024 NHT 35 MC

The vertices of the graph below represent cabins in a holiday park, and the water pump \((P)\) that will supply them. The numbers on the edges show the length, in metres, of water pipe required to connect the cabins and the pump.
 

The water pipes will cost $52 per metre. What is the minimum cost to link all the cabins to the water pump \((P)\) ?

  1. $3744
  2. $3796
  3. $3848
  4. $3900
  5. $3952
Show Answers Only

\(B\)

Show Worked Solution

Minimum spanning tree:
 

\(\text{MST}\ =8+9+11+8+9+9+7+12=73\)

\(\therefore\ \text{Minimum cost}\ = 73 \times 52=\$3796\)

\(\Rightarrow B\)

Filed Under: Flow Problems Tagged With: Band 4, smc-625-20-Max Flow/Min Cut

Networks, GEN2 2024 VCAA 14

A manufacturer \((M)\) makes deliveries to the supermarket \((S)\) via a number of storage warehouses, \(L, N, O, P, Q\) and \(R\). These eight locations are represented as vertices in the network below.

The numbers on the edges represent the maximum number of deliveries that can be made between these locations each day.
 

  1. When considering the possible flow of deliveries through this network, many different cuts can be made.   
  2. Determine the capacity of Cut 1, shown above.   (1 mark)

    --- 1 WORK AREA LINES (style=lined) ---

  3. Determine the maximum number of deliveries that can be made each day from the manufacturer to the supermarket.   (1 mark)

    --- 1 WORK AREA LINES (style=lined) ---

  4. The manufacturer wants to increase the number of deliveries to the supermarket.
  5. This can be achieved by increasing the number of deliveries between one pair of locations.
  6. Complete the following sentence by writing the locations on the lines provided:
  7. To maximise this increase, the number of deliveries should be increased between
    locations ____ and  ____.
       (1 mark)

    --- 0 WORK AREA LINES (style=lined) ---


Show Answers Only

a.    \(46\)

b.    \(37\)

c.    \(\text{R and S}\)

Show Worked Solution

a.    \(13+18+6+9=46\)

\(\text{(Reverse flow}\ Q → O\ \text{is not counted.)}\)
 

b.  

\(\text{Max deliveries (min cut)}\ =13+5+11+8=37\)

♦ Mean mark (b) 29%.

 
c.   
\(\text{The number of deliveries should be increased between}\)

\(\text{locations R and S.}\)

♦ Mean mark (c) 22%.

Filed Under: Flow Problems Tagged With: Band 3, Band 5, Band 6, smc-625-10-Cut Capacity, smc-625-20-Max Flow/Min Cut, smc-625-25-Network adjustments

Networks, GEN1 2023 VCAA 39-40 MC

The network below shows the one-way paths between the entrance, \(A\), and the exit, \(H\), of a children's maze.

The vertices represent the intersections of the one-way paths.

The number on each edge is the maximum number of children who are allowed to travel along that path per minute.
 

Question 39

Cuts on this network are used to consider the possible flow of children through the maze. The capacity of the minimum cut would be

  1. 20
  2. 23
  3. 24
  4. 29
  5. 30

 
Question 40

One path in the maze is to be changed.

Which one of these five changes would lead to the largest increase in flow from entrance to exit?

  1. increasing the capacity of flow along the edge \(C E\) to 12
  2. increasing the capacity of flow along the edge \(FH\) to 14
  3. increasing the capacity of flow along the edge \(GH\) to 16
  4. reversing the direction of flow along the edge \(C F\)
  5. reversing the direction of flow along the edge \(G F\)
Show Answers Only

\(\text{Question 39:}\ B \)

\(\text{Question 40:}\ E \)

Show Worked Solution

\(\text{Question 39} \)

\(\text{Minimum cut}\ = 12+4+7 = 23\)

\(\Rightarrow B\)
 

\(\text{Question 40}\)

\(CE ↑ 12,\ \text{minimum cut = 24}\)

\(FH ↑ 14,\ \text{minimum cut = 23}\)

\(GH ↑ 16,\ \text{minimum cut = 27}\)

\(CF\ \text{is reversed, minimum cut = 29}\)

\(GF\ \text{is reversed, minimum cut = 30 (close to exit H)}\)

\(\Rightarrow E\)

Filed Under: Flow Problems Tagged With: Band 5, smc-625-20-Max Flow/Min Cut, smc-625-25-Network adjustments

NETWORKS, FUR2 2021 VCAA 3

The network diagram below shows the local road network of Town `M`.

The number on the edges indicate the maximum number of vehicles per hour that can travel along each road in this network.

The arrows represent the permitted direction of travel.

The vertices `A, B, C, D, E` and `F` represent the intersections of the roads.
 

  1. Determine the maximum number of vehicles that can travel from the entrance to the exit per hour.   (1 mark)

    --- 1 WORK AREA LINES (style=lined) ---

  2. The local council plans to increase the number of vehicles per hour that can travel from the entrance to the exit by increasing the capacity of only one road.
  3.  i. Complete the following sentence by filling in the boxes provided.   (1 mark)

    --- 0 WORK AREA LINES (style=lined) ---

        The road that should have its capacity increased is the road from vertex  
     
     to 
     
  4. ii. What should be the minimum capacity of this road to maximise the flow of vehicles from the entrance to the exit?   (1 mark)

    --- 5 WORK AREA LINES (style=lined) ---

Show Answers Only
  1. `1330`
  2.  i. `A\ text(to)\ D`
  3. ii. `780`
Show Worked Solution

a.     

`text{Minimum cut}` `= 680 + 650`
  `= 1330`

 
`:. \ text{Maximum number of vehicles} = 1330`


b.i.  `text{Vehicles from} \ A \ text{to} \ B \ text{restricted to 700 per hour.}`

`:. \ text{Road to increase capacity is from} \ A \ text{to} \ D.`
 

b.ii. `text{Minimum cut} = 1330 \ text{(partial)}`

 `text{Next lowest cut} = 620 + 840 = 1460`


`text{Extra capacity} = 1460 – 1330 = 130`

`:. \ text{Minimum capacity of road} \ A \ text{to}\ D \ text{should be}`

`= 650 + 130`

`= 780`

Filed Under: Flow Problems Tagged With: Band 5, Band 6, smc-625-20-Max Flow/Min Cut

NETWORKS, FUR2 2020 VCAA 4

Training program 1 has the cricket team starting from exercise station `S` and running to exercise station `O`.

For safety reasons, the cricket coach has placed a restriction on the maximum number of people who can use the tracks in the fitness park.

The directed graph below shows the capacity of the tracks, in number of people per minute.


  1. How many different routes from `S` to `O` are possible?   (1 mark)

    --- 2 WORK AREA LINES (style=lined) ---

When considering the possible flow of people through this network, many different cuts can be made.

  1. Determine the capacity of Cut 1, shown above.   (1 mark)

    --- 2 WORK AREA LINES (style=lined) ---

  2. What is the maximum flow from `S` to `O`, in number of people per minute?   (1 mark)

    --- 3 WORK AREA LINES (style=lined) ---

Show Answers Only
  1. `10`
  2. `52`
  3. `50`
Show Worked Solution
a.   `text(Routes: )` `SMO, STUNO, STUVO, STUVPO, SRQUNO,SRQUVO,`
    `SRQUVPO, SRQVO, SRQVPO, SRQPO`

♦♦ Mean mark part (a) 30%.

 
`:. 10\ text(routes)`


b.   `text{Capacity (Cut 1)}` `= 20 + 12 + 20`
    `= 52`


c.   `text(Max flow/minimum cut)`

♦♦ Mean mark part (c) 32%.

`= 20 + 10 + 20`

`= 50`
 

Filed Under: Flow Problems Tagged With: Band 4, Band 5, smc-625-10-Cut Capacity, smc-625-20-Max Flow/Min Cut

NETWORKS, FUR1 2020 VCAA 9 MC

The flow of liquid through a series of pipelines, in litres per minute, is shown in the directed network below.


Five cuts labelled A to E are shown on the network.

The number of these cuts with a capacity equal to the maximum flow of liquid from the source to the sink, in litres per minute, is

  1. 1
  2. 2
  3. 3
  4. 4
  5. 5
Show Answers Only

`C`

Show Worked Solution

`text(Minimum cut) = 33`

`text(Cut)\ A = 8 + 15 + 15 = 38`

`text(Cut)\ B = 8 + 15 + 10 = 33`

`text(Cut)\ C = 15 + 8 + 10 = 33`

`text(Cut)\ D = 15 + 8 + 10 = 33`

`text(Cut)\ E = 15 + 8 + 5 + 10 = 38`

`text{(Note that it is arguable that the flow of 5 should not be counted}`

`text{in Cut}\ E,\ text(making the correct answer)\ D.\ text(This is because this)`

`text{edge cannot hold any flow in the network as given.)}`

`=>  C`

Filed Under: Flow Problems Tagged With: Band 6, smc-625-20-Max Flow/Min Cut

NETWORKS, FUR1 2019 STD2 40

A museum is planning an exhibition using five rooms.

The museum manager draws a network to help plan the exhibition. The vertices `A`, `B`, `C`, `D` and `E` represent the five rooms. The number on the edges represent the maximum number of people per hour who can pass through the security checkpoints between the rooms.


  1. What is the capacity of the cut shown?   (1 mark)

    --- 2 WORK AREA LINES (style=lined) ---

  2. The museum manager is planning for a maximum of 240 visitors to pass through the exhibition each hour. By using the 'minimum cut-maximum flow' theorem, the manager determines that the plan does not provide sufficient flow capacity.


    Draw the minimum cut onto the network below and recommend a change that the manager could make to one or more security checkpoints to increase the flow capacity to 240 visitors per hour.   (2 marks)

    --- 4 WORK AREA LINES (style=lined) ---


Show Answers Only
  1. `290`
  2.   

Show Worked Solution
a.    `text(Capacity)` `= 130 + 90 + 70`
    `= 290`

♦♦ Mean mark 32%.
COMMENT: In part (a), edge BC flows from the exit to the entry and is therefore not counted.

b.   `text(Maximum flow capacity:)`
   

`text(Minimum cut = 80 + 40 + 65 + 45 = 230)`

♦♦♦ Mean mark 19%.
COMMENT: In part (b), edge BC now flows from entry to exit in the new “minimum” cut and is counted.

`text(If security is improved to increase the flow)`

`text(between Room C and Room B by 10 visitors)`

`text(per hour, the network’s flow capacity increases)`

`text(to 240.)`

Filed Under: Flow Problems Tagged With: Band 5, Band 6, smc-625-10-Cut Capacity, smc-625-20-Max Flow/Min Cut

NETWORKS, FUR2 2018 VCAA 1

The graph below shows the possible number of postal deliveries each day between the Central Mail Depot and the Zenith Post Office.

The unmarked vertices represent other depots in the region.

The weighting of each edge represents the maximum number of deliveries that can be made each day.


  1.  Cut A, shown on the graph, has a capacity of 10.


     Two other cuts are labelled as Cut B and Cut C.
     i.  Write down the capacity of Cut B.   (1 mark)

    --- 2 WORK AREA LINES (style=lined) ---

    ii.  Write down the capacity of Cut C.   (1 mark)

    --- 2 WORK AREA LINES (style=lined) ---

  1. Determine the maximum number of deliveries that can be made each day from the Central Mail   Depot to the Zenith Post Office.   (1 mark)

    --- 2 WORK AREA LINES (style=lined) ---

Show Answers Only
  1.  i.  `9`
    ii.  `13`
  2.  `7`
Show Worked Solution
a.i.    `text{Capacity (Cut B)}` `= 3 + 2 + 4`
    `= 9`


a.ii.    `text{Capacity (Cut C)}` `= 3 + 6 + 4`
    `= 13`

♦ Mean mark part (b) 32%.
COMMENT: Review carefully! Most common incorrect answer was 9.


b.  `text(Minimum cut) = 2 + 2 + 3 = 7`

`:.\ text(Maximum deliveries) = 7`

Filed Under: Flow Problems Tagged With: Band 3, Band 5, smc-625-10-Cut Capacity, smc-625-20-Max Flow/Min Cut

NETWORKS, FUR1 2017 VCAA 8 MC

The flow of oil through a series of pipelines, in litres per minute, is shown in the network below.


The weightings of three of the edges are labelled `x`.

Five cuts labelled A–E are shown on the network.

The maximum flow of oil from the source to the sink, in litres per minute, is given by the capacity of

  1. `text(Cut A if)\ x = 1`
  2. `text(Cut B if)\ x = 2`
  3. `text(Cut C if)\ x = 2`
  4. `text(Cut D if)\ x = 3`
  5. `text(Cut E if)\ x = 3`
Show Answers Only

`B`

Show Worked Solution

`=> B`

Filed Under: Flow Problems Tagged With: Band 6, smc-625-20-Max Flow/Min Cut

NETWORKS, FUR1 2016 VCAA 2 MC

The following directed graph shows the flow of water, in litres per minute, in a system of pipes connecting the source to the sink.


The maximum flow, in litres per minute, from the source to the sink is

  1. `10`
  2. `14`
  3. `18`
  4. `20`
  5. `22`
Show Answers Only

`C`

Show Worked Solution
`text(Maximum flow)` `= 2 + 10 + 6`
  `= 18\ \ text(litres/minute)`

`=> C`

Filed Under: Flow Problems Tagged With: Band 4, smc-625-20-Max Flow/Min Cut

NETWORKS, FUR1 2010 VCAA 6-7 MC

In the network below, the values on the edges give the maximum flow possible between each pair of vertices. The arrows show the direction of flow. A cut that separates the source from the sink in the network is also shown.
 

vcaa-networks-fur1-2010-6-7

 
Part 1

The capacity of this cut is

A.   `14`

B.   `18`

C.   `23`

D.   `31`

E.   `40`


Part 2

The maximum flow between source and sink through the network is

A.    `7`

B.   `10`

C.   `11`

D.   `12`

E.   `20`

Show Answers Only

`text(Part 1:)\ C`

`text(Part 2:)\ B`

Show Worked Solution

Part 1

`text(Capacity of the cut)`

♦ Mean mark 50%.
COMMENT: A quarter of students incorrectly included the “8” which is flowing in the opposite direction.

`= 11 + 5 + 7`

`= 23`

`=>  C`


Part 2

vcaa-networks-fur1-2010-6-7i

`text(The maximum flow)`

♦♦♦ Mean mark 24%.

`=\ text{minimum cut (see above)}`

`= 4 + 2 + 3 + 1`

`= 10`

`=>  B`

Filed Under: Flow Problems Tagged With: Band 4, Band 5, smc-625-10-Cut Capacity, smc-625-20-Max Flow/Min Cut

NETWORKS, FUR1 2009 VCAA 3 MC

networks-fur1-2009-vcaa-3-mc1

 
The maximum flow from source to sink through the network shown above is

A.     `6`

B.     `7`

C.     `8`

D.   `11`

E.   `16`

Show Answers Only

`B`

Show Worked Solution

networks-fur1-2009-vcaa-3-mc-answer 
 

♦ Mean mark 44%.
`text(Maximum flow)` `=\ text(minimum cut)`
  `= 1 + 4 + 2`
  `= 7`

`=>  B`

Filed Under: Flow Problems Tagged With: Band 5, smc-625-20-Max Flow/Min Cut

NETWORKS, FUR1 2012 VCAA 7 MC

Vehicles from a town can drive onto a freeway along a network of one-way and two-way roads, as shown in the network diagram below.

The numbers indicate the maximum number of vehicles per hour that can travel along each road in this network. The arrows represent the permitted direction of travel.

One of the four dotted lines shown on the diagram is the minimum cut for this network.
  

networks-fur1-2012-vcaa-7-mc-1

 
The maximum number of vehicles per hour that can travel through this network from the town onto the freeway is

A.  `310`

B.  `330`

C.  `350`

D.  `370`

E.  `390`

Show Answers Only

`C`

Show Worked Solution

`text(Consider each “minimum cut” line,)`

♦♦♦ Mean mark 23%.

`text(Line 1: doesn’t seperate the town and freeway)`

`text(Line 2: 240 + 110 = 350)`

`text(Line 3: 240 + 60 + 90 = 390)`

`text(Line 4: 280 + 90 = 370)`

`:.\ text(Line 2 gives the maximum flow)`

`rArr C`

Filed Under: Flow Problems Tagged With: Band 6, smc-625-20-Max Flow/Min Cut

NETWORKS, FUR2 2007 VCAA 3

As an attraction for young children, a miniature railway runs throughout the new housing estate.

The trains travel through stations that are represented by nodes on the directed network diagram below.

The number of seats available for children, between each pair of stations, is indicated beside the corresponding edge.
 

NETWORKS, FUR2 2007 VCAA 3

 
Cut 1, through the network, is shown in the diagram above.

  1. Determine the capacity of Cut 1.   (1 mark)

    --- 3 WORK AREA LINES (style=lined) ---

  2. Determine the maximum number of seats available for children for a journey that begins at the West Terminal and ends at the East Terminal.   (1 mark)

    --- 3 WORK AREA LINES (style=lined) ---

On one particular train, 10 children set out from the West Terminal.

No new passengers board the train on the journey to the East Terminal.

  1. Determine the maximum number of children who can arrive at the East Terminal on this train.   (1 mark)

    --- 5 WORK AREA LINES (style=lined) ---

Show Answers Only
  1. `43`
  2. `22`
  3. `7`
Show Worked Solution

a.   `text(The capacity of Cut 1)`

♦♦ Mean mark for all parts (combined) was 33%.
MARKER’S COMMENT: A common error was counting the edge with “10” in the reverse direction (it should be ignored).

`=14 + 8 + 13 + 8`

`= 43`


b.    networks-fur2-2007-vcaa-3-answer
`text(Maximum seats)` `=\ text(minimum cut)`
  `= 6 + 7 + 9`
  `= 22`


c.  `text{The path (edge weights) of the train setting out with}`

`text(10 children starts with: 11 → 13.)`

`text(At the next station, a maximum of 7 seats are available)`

`text(which remain until the East Terminal.)`
  

`:.\ text(Maximum number of children arriving is 7.)`

Filed Under: Flow Problems Tagged With: Band 5, Band 6, smc-625-10-Cut Capacity, smc-625-20-Max Flow/Min Cut

NETWORKS, FUR1 2014 VCAA 9 MC

A network of tracks connects two car parks in a festival venue to the exit, as shown in the directed graph below.


The arrows show the direction that cars can travel along each of the tracks and the numbers show each track’s capacity in cars per minute.

Five cuts are drawn on the diagram.

The maximum number of cars per minute that will reach the exit is given by the capacity of

A.  Cut A

B.  Cut B

C.  Cut C

D.  Cut D

E.  Cut E

Show Answers Only

`D`

Show Worked Solution

`text(Cut)\ A and B\ text(don’t separate both)`

♦♦♦ Mean mark 24%.
COMMENT: Note that the “4” is not included in Cut D as it is flowing in the opposite direction.

`text(car parks from the exit.)`

`text(Cut)\ D\ text(has the minimum cut of)`

`text(the three cuts remaining.)`

`=>  D`

Filed Under: Flow Problems Tagged With: Band 6, smc-625-20-Max Flow/Min Cut

NETWORKS, FUR2 2013 VCAA 3

The rangers at the wildlife park restrict access to the walking tracks through areas where the animals breed.

The edges on the directed network diagram below represent one-way tracks through the breeding areas. The direction of travel on each track is shown by an arrow. The numbers on the edges indicate the maximum number of people who are permitted to walk along each track each day.
 

NETWORKS, FUR2 2013 VCAA 31
 

  1. Starting at `A`, how many people, in total, are permitted to walk to `D` each day?   (1 mark)

    --- 2 WORK AREA LINES (style=lined) ---

One day, all the available walking tracks will be used by students on a school excursion.

The students will start at `A` and walk in four separate groups to `D`.

Students must remain in the same groups throughout the walk.

  1. i. Group 1 will have 17 students. This is the maximum group size that can walk together from `A` to `D`.
    Write down the path that group 1 will take.  (1 mark)

    --- 1 WORK AREA LINES (style=lined) ---

  2. ii. Groups 2, 3 and 4 will each take different paths from `A` to `D`.
    Complete the six missing entries shaded in the table below.   (2 marks)

    --- 4 WORK AREA LINES (style=lined) ---

NETWORKS, FUR2 2013 VCAA 32

Show Answers Only
  1. `37`
    1. `A-B-E-C-D`
    2.  `text{One possible solution is:}`
       
      Networks, FUR2 2013 VCAA 3_2 Answer1
Show Worked Solution
a.    `text(Maximum flow)` `=\ text(minimum cut through)\ CD and ED`
    `= 24 + 13`
    `= 37`
♦ Mean mark of all parts (combined) was 41%.


`:.\ text(A maximum of 37 people can walk)`

`text(to)\ D\ text(from)\ A.`
  

b.i.   `A-B-E-C-D`
  

b.ii.   `text(One solution using the second possible largest)`

  `text(group of 11 students and two groups from the)`

  `text(remaining 9 students is:)`

Networks, FUR2 2013 VCAA 3_2 Answer1

Filed Under: Flow Problems Tagged With: Band 4, Band 5, Band 6, smc-625-10-Cut Capacity, smc-625-20-Max Flow/Min Cut

NETWORKS, FUR2 2011 VCAA 4

Stormwater enters a network of pipes at either Dunlop North (Source 1) or Dunlop South (Source 2) and flows into the ocean at either Outlet 1 or Outlet 2.

On the network diagram below, the pipes are represented by straight lines with arrows that indicate the direction of the flow of water. Water cannot flow through a pipe in the opposite direction.

The numbers next to the arrows represent the maximum rate, in kilolitres per minute, at which stormwater can flow through each pipe.


NETWORKS, FUR2 2011 VCAA 4_1
 

  1. Complete the following sentence for this network of pipes by writing either the number 1 or 2 in each box.  (1 mark)

    --- 0 WORK AREA LINES (style=lined) ---

NETWORKS, FUR2 2011 VCAA 4_2

  1. Determine the maximum rate, in kilolitres per minute, that water can flow from these pipes into the ocean at Outlet 1 and Outlet 2.  (2 marks)

    --- 5 WORK AREA LINES (style=lined) ---

A length of pipe, show in bold on the network diagram below, has been damaged and will be replaced with a larger pipe.


NETWORKS, FUR2 2011 VCAA 4_3
 

  1. The new pipe must enable the greatest possible rate of flow of stormwater into the ocean from Outlet 2.
  2. What minimum rate of flow through the pipe, in kilolitres per minute, will achieve this?  (1 mark)

    --- 3 WORK AREA LINES (style=lined) ---

Show Answers Only

  1. `text(Storm water from Source 2 cannot reach Outlet 1)`
  2. `text(Outlet 1: 700 kL/min)`
    `text(Outlet 2: 700 kL/min)`
  3. `text(300 kL per min)`

Show Worked Solution

a.   `text(Storm water from Source 2 cannot reach Outlet 1)`

♦ Mean mark of all parts (combined) was 35%.


b.    NETWORKS, FUR2 2011 VCAA 4 Answer

 
`text(The minimum cut includes the 200 kL/min pipe from Source 1.)`

`:.\ text(Maximum rates are)`

`text(Outlet 1: 700 kL/min)`

`text(Outlet 2: 700 kL/min)`


c.   `text(The next smallest cut in the lower pipe system is 800.)`

`:.\ text(The minimum flow through the new pipe that will achieve)`

`text(this is 300 kL/min.)`

Filed Under: Flow Problems Tagged With: Band 4, Band 5, Band 6, smc-625-20-Max Flow/Min Cut

Copyright © 2014–2025 SmarterEd.com.au · Log in