SmarterEd

Aussie Maths & Science Teachers: Save your time with SmarterEd

  • Login
  • Get Help
  • About

Functions, EXT1 EQ-Bank 23

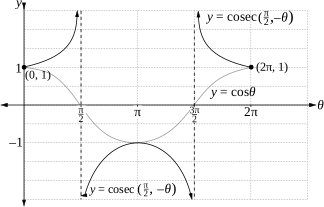
Consider the function  \(f(\theta)=\operatorname{cosec}\left(\frac{\pi}{2}-\theta\right)\)  for  \(0 \leqslant \theta \leqslant 2 \pi\).

  1. Sketch the graph of  \(y=\operatorname{cosec}\left(\frac{\pi}{2}-\theta\right)\),  showing all key features.   (2 marks)


    --- 0 WORK AREA LINES (style=lined) ---

  2. In set notation, state the range of \(\theta\).   (1 mark)

    --- 2 WORK AREA LINES (style=lined) ---

Show Answers Only

a.     


b.   \(\text{Range} \ \ f(\theta):\ y \in(-\infty,-1] \cup[1, \infty)\)

Show Worked Solution

a.    \(y=\operatorname{cosec}\left(\frac{\pi}{2}-\theta\right)=\dfrac{1}{\sin \left(\frac{\pi}{2}-\theta\right)}=\dfrac{1}{\cos\, \theta}\)


b.   \(\text{Range} \ \ f(\theta):\ y \in(-\infty,-1] \cup[1, \infty)\)
Filed Under: Graphical Relationships Tagged With: Band 4, smc-6640-15-cosec/sec/cot, syllabus-2027

Functions, EXT1 EQ-Bank 24

Consider the functions  \(f(x)=\tan x\)  and  \(g(x)=\cot x\).

  1. Explain why  \(\cot x \neq \dfrac{1}{\tan x}\)  for all values of \(x\).   (2 marks)

    --- 5 WORK AREA LINES (style=lined) ---

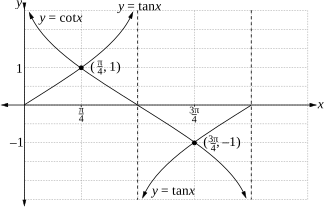
  2. On the same set of axes below, sketch  \(y=\tan x\)  and  \(y=\cot x\)  for  \(0<x<\pi\), identifying any points where the graphs intersect.   (2 marks)


--- 0 WORK AREA LINES (style=lined) ---

Show Answers Only

a.    \(\text{At}\ \  x=\dfrac{\pi}{2}:\)

\(\cot \dfrac{\pi}{2}=\dfrac{\cos \frac{\pi}{2}}{\sin \frac{\pi}{2}}=\dfrac{0}{1}=0 \ \Rightarrow \ \text{defined}\).

\(\tan \dfrac{\pi}{2}=\dfrac{\sin \frac{\pi}{2}}{\cos \frac{\pi}{2}}=\dfrac{1}{0} \Rightarrow \ \text{undefined}\).

\(\dfrac{1}{\tan \frac{\pi}{2}}\ \ \text{is therefore undefined}\).

\(\therefore \cot x \neq \dfrac{1}{\tan x} \ \ \text{for all values of }\ x\).
 

b.
       

Show Worked Solution

a.    \(\text{At}\ \  x=\dfrac{\pi}{2}:\)

\(\cot \dfrac{\pi}{2}=\dfrac{\cos \frac{\pi}{2}}{\sin \frac{\pi}{2}}=\dfrac{0}{1}=0 \ \Rightarrow \ \text{defined}\).

\(\tan \dfrac{\pi}{2}=\dfrac{\sin \frac{\pi}{2}}{\cos \frac{\pi}{2}}=\dfrac{1}{0} \Rightarrow \ \text{undefined}\).

\(\dfrac{1}{\tan \frac{\pi}{2}}\ \ \text{is therefore undefined}\).

\(\therefore \cot x \neq \dfrac{1}{\tan x} \ \ \text{for all values of }\ x\).
 

b.
       

Filed Under: Graphical Relationships Tagged With: Band 4, smc-6640-15-cosec/sec/cot, syllabus-2027

Functions, EXT1 EQ-Bank 18

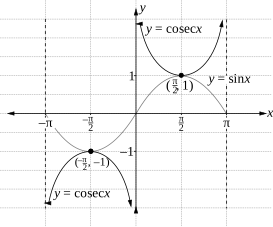
Consider the function  \(y=\operatorname{cosec}\,x\)  for  \(-\pi \leqslant x \leqslant \pi\).

  1. State the equations of all vertical asymptotes in the given domain.   (1 mark)

    --- 3 WORK AREA LINES (style=lined) ---

  2. Sketch the graph of  \(y=\operatorname{cosec} x\), showing all key features.   (2 marks)

    --- 0 WORK AREA LINES (style=lined) ---


Show Answers Only

a.    \(y=\operatorname{cosec}\,x=\dfrac{1}{\sin x}\)

\(\text{Asymptotes when \(\ \sin x=0 \ \) in given domain.}\)

\(\therefore \ \text{Asymptotes at} \ \ x=-\pi, 0, \pi\)
 

b.
       

Show Worked Solution

a.    \(y=\operatorname{cosec}\,x=\dfrac{1}{\sin x}\)

\(\text{Asymptotes when \(\ \sin x=0 \ \) in given domain.}\)

\(\therefore \ \text{Asymptotes at} \ \ x=-\pi, 0, \pi\)
 

b.
       

Filed Under: Graphical Relationships Tagged With: Band 3, Band 4, smc-6640-15-cosec/sec/cot, syllabus-2027

Functions, EXT1 EQ-Bank 17

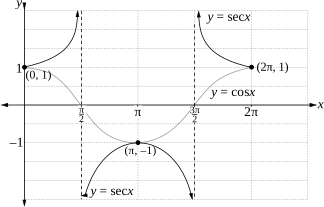
  1. Sketch the graph of  \(y=\sec x\)  for  \(0 \leqslant x \leqslant 2 \pi\).
  2. In your answer, identify all asymptotes and the coordinates of any maximum and minimum turning points.   (2 marks)

    --- 0 WORK AREA LINES (style=lined) ---


  3. Using set notation, state the domain and range of  \(y=\sec x\).   (1 mark)

    --- 2 WORK AREA LINES (style=lined) ---

Show Answers Only

a.
   

b.    \(\text{Domain:} \ x \in\left[0, \frac{\pi}{2}\right) \cup\left(\frac{\pi}{2}, \frac{3 \pi}{2}\right) \cup\left(\frac{3 \pi}{2}, 2 \pi\right]\)

\(\text{Range:} \ y \in(-\infty,-1] \cup[1, \infty)\)
Show Worked Solution

a.    \(\text{Draw}\ \ y=\cos\,x\ \ \text{to inform graph:}\)


\(\text{Minimum TPs:}\ (0,1), (2\pi, 1) \)

\(\text{Maximum TP:}\ (\pi, -1)\)
 

b.    \(\text{Domain:} \ x \in\left[0, \frac{\pi}{2}\right) \cup\left(\frac{\pi}{2}, \frac{3 \pi}{2}\right) \cup\left(\frac{3 \pi}{2}, 2 \pi\right]\)

\(\text{Range:} \ y \in(-\infty,-1] \cup[1, \infty)\)
Filed Under: Graphical Relationships Tagged With: Band 3, Band 4, smc-6640-15-cosec/sec/cot, syllabus-2027

Copyright © 2014–2026 SmarterEd.com.au · Log in