A boat is purchased for $15 000. It depreciates in value by $3000 per year.
Let \(V\) = Value of the boat in dollars, and \(t\) = time in years.
- Complete the table of values below that models the relationship between the value of the boat and time in years. (1 mark)
\(\begin{array}{|c|c|c|c|c|c|c|} \hline \vphantom{\dfrac{1}{1}}\quad t \quad & \quad 0 \quad & \quad 1 \quad & \quad 2 \quad & \quad 3 \quad & \quad 4 \quad & \quad 5 \quad \\[6pt] \hline \vphantom{\dfrac{1}{1}}V & 15\,000 & & 9000 & & 3000 & \\[12pt] \hline \end{array}\)
--- 0 WORK AREA LINES (style=lined) ---
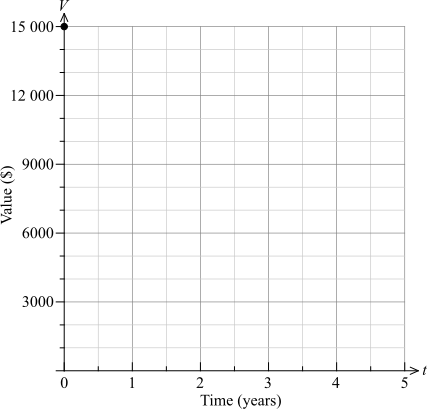
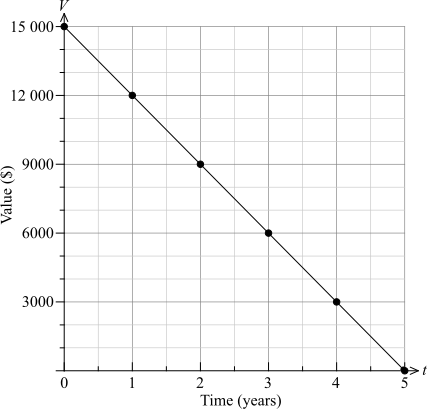
- Using the table of values from (a), neatly graph the value of the boat from 0 to 5 years on the grid below. (2 marks)
--- 0 WORK AREA LINES (style=lined) ---
- Identify ONE limitation of this linear model. (1 mark)
--- 3 WORK AREA LINES (style=lined) ---
a. \(\text{Table of values}\)
\begin{array}{|c|c|c|c|c|c|c|} \hline t & 0 & 1 & 2 & 3 & 4 & 5 \\ \hline V & 15\ 000 & \textbf{12 000} & 9000 & \textbf{6000} & 3000 & \ \ \ \ \textbf{0}\ \ \ \ \\ \hline \end{array}
b.
c. \(\text{Limitations could include ONE of the following:}\)
-
- \(\text{The model predicts the boat has zero value after 5 years, which is}\)
\(\text{unrealistic as most boats retain some value.}\) - \(\text{Beyond 5 years the model would predict a negative value, which is}\)
\(\text{not possible.}\) - \(\text{The model assumes a constant rate of depreciation, but in reality}\)
\(\text{a boat may depreciate more quickly in early years.}\)
- \(\text{The model predicts the boat has zero value after 5 years, which is}\)
a. \(\text{Table of values}\)
\begin{array}{|c|c|c|c|c|c|c|} \hline t & 0 & 1 & 2 & 3 & 4 & 5 \\ \hline V & 15\ 000 & \textbf{12 000} & 9000 & \textbf{6000} & 3000 & \ \ \ \ \textbf{0}\ \ \ \ \\ \hline \end{array}
b.
c. \(\text{Limitations could include ONE of the following:}\)
-
- \(\text{The model predicts the boat has zero value after 5 years, which is}\)
\(\text{unrealistic as most boats retain some value.}\) - \(\text{Beyond 5 years the model would predict a negative value, which is}\)
\(\text{not possible.}\) - \(\text{The model assumes a constant rate of depreciation, but in reality}\)
\(\text{a boat may depreciate more quickly in early years.}\)
- \(\text{The model predicts the boat has zero value after 5 years, which is}\)