SmarterEd

Aussie Maths & Science Teachers: Save your time with SmarterEd

  • Login
  • Get Help
  • About

Algebra, STD1 EQ-Bank 13

A boat is purchased for $15 000. It depreciates in value by $3000 per year.

Let  \(V\) = Value of the boat in dollars, and  \(t\) = time in years.

  1. Complete the table of values below that models the relationship between the value of the boat and time in years.   (1 mark)
      
    \(\begin{array}{|c|c|c|c|c|c|c|} \hline \vphantom{\dfrac{1}{1}}\quad t \quad & \quad 0 \quad & \quad 1 \quad & \quad 2 \quad & \quad 3 \quad & \quad 4 \quad & \quad 5 \quad \\[6pt] \hline \vphantom{\dfrac{1}{1}}V & 15\,000 &  & 9000 &  & 3000 &  \\[12pt] \hline \end{array}\)

    --- 0 WORK AREA LINES (style=lined) ---

  2. Using the table of values from (a), neatly graph the value of the boat from 0 to 5 years on the grid below.   (2 marks)

    --- 0 WORK AREA LINES (style=lined) ---
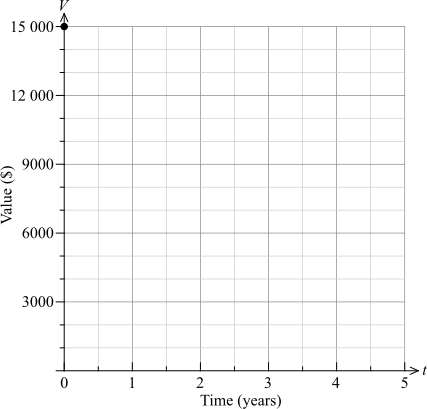


  3. Identify ONE limitation of this linear model.   (1 mark)

    --- 3 WORK AREA LINES (style=lined) ---

Show Answers Only

a.    \(\text{Table of values}\)

\begin{array}{|c|c|c|c|c|c|c|} \hline t & 0 & 1 & 2 & 3 & 4 & 5 \\ \hline V & 15\ 000 & \textbf{12 000} & 9000 & \textbf{6000} & 3000 & \ \ \ \ \textbf{0}\ \ \ \  \\ \hline \end{array}

b.  
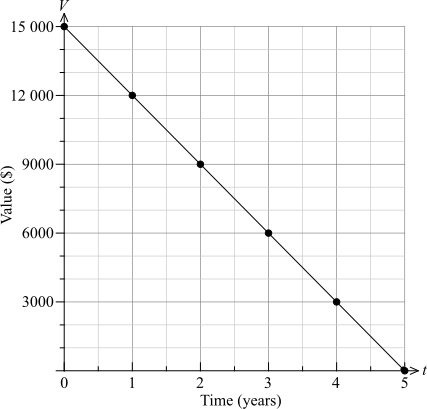
     

c.     \(\text{Limitations could include ONE of the following:}\)

    • \(\text{The model predicts the boat has zero value after 5 years, which is}\)
      \(\text{unrealistic as most boats retain some value.}\)
    • \(\text{Beyond 5 years the model would predict a negative value, which is}\)
      \(\text{not possible.}\)
    • \(\text{The model assumes a constant rate of depreciation, but in reality}\)
      \(\text{a boat may depreciate more quickly in early years.}\)
Show Worked Solution

a.    \(\text{Table of values}\)

\begin{array}{|c|c|c|c|c|c|c|} \hline t & 0 & 1 & 2 & 3 & 4 & 5 \\ \hline V & 15\ 000 & \textbf{12 000} & 9000 & \textbf{6000} & 3000 & \ \ \ \ \textbf{0}\ \ \ \  \\ \hline \end{array}

 
b.  


c.     \(\text{Limitations could include ONE of the following:}\)

    • \(\text{The model predicts the boat has zero value after 5 years, which is}\)
      \(\text{unrealistic as most boats retain some value.}\)
    • \(\text{Beyond 5 years the model would predict a negative value, which is}\)
      \(\text{not possible.}\)
    • \(\text{The model assumes a constant rate of depreciation, but in reality}\)
      \(\text{a boat may depreciate more quickly in early years.}\)

Filed Under: Graphs of Practical Situations Tagged With: Band 3, Band 4, smc-6840-05-Linear Graphs, smc-6840-15-Strengths and Limitations

Algebra, STD1 EQ-Bank 15

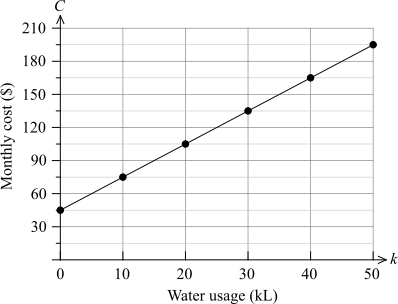
A household's monthly water bill consists of a fixed service charge of $45 plus $3 per kilolitre of water used.

Let  \(C\) = monthly cost in dollars, and  \(k\) = water usage in kilolitres.

  1. Complete the table of values below that models the relationship between water usage and monthly cost.   (1 mark)
      
    \(\begin{array}{|c|c|c|c|c|c|c|} \hline \vphantom{\dfrac{1}{1}}\quad k \quad & \quad 0 \quad & \quad 10 \quad & \quad 20 \quad & \quad 30 \quad & \quad 40 \quad & \quad 50 \quad \\[6pt] \hline \vphantom{\dfrac{1}{1}}C &  & 75 & 105 &  & 165 & 195 \\[12pt] \hline \end{array}\)

    --- 0 WORK AREA LINES (style=lined) ---

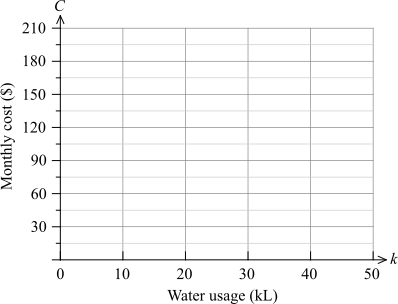
  2. Using the table of values from (a), neatly graph the monthly cost for water usage from 0 to 50 kL on the grid below.   (1 mark)

    --- 0 WORK AREA LINES (style=lined) ---


  3. Using your graph from (b), or otherwise, find the monthly cost when the household uses 35 kL of water.   (1 mark)

    --- 2 WORK AREA LINES (style=lined) ---

Show Answers Only

a.    \(\text{Table of values}\)

\begin{array}{|c|c|c|c|c|c|c|} \hline k & 0 & 10 & 20 & 30 & 40 & 50 \\ \hline C & \textbf{45} & 75 & 105 & \textbf{135} & 165 & 195 \\ \hline \end{array}

b.     

c.    \($120\)

Show Worked Solution

a.    \(\text{Table of values:}\)

\begin{array}{|c|c|c|c|c|c|c|} \hline k & 0 & 10 & 20 & 30 & 40 & 50 \\ \hline C & \textbf{45} & 75 & 105 & \textbf{135} & 165 & 195 \\ \hline \end{array}

 
b.  


c.    \(\text{From the graph, when } k=35,\ \ C=\$120\)

Filed Under: Graphs of Practical Situations Tagged With: Band 3, Band 4, smc-6840-05-Linear Graphs

Algebra, STD1 EQ-Bank 14

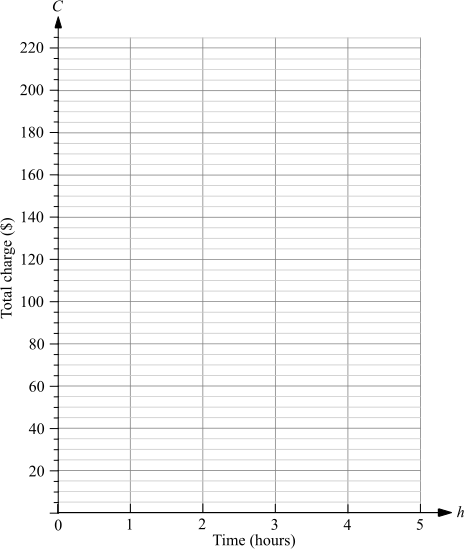
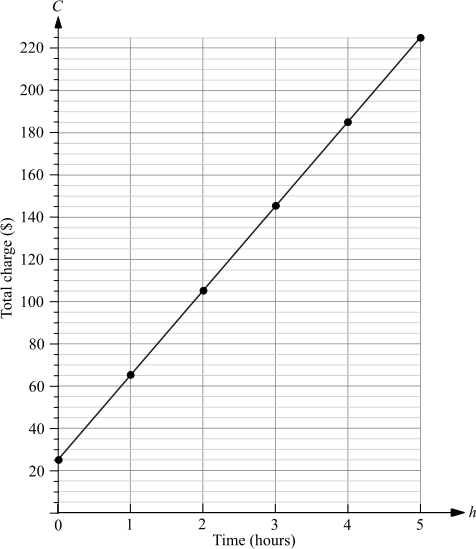
GreenCut Lawn Services charges a fixed call-out fee of $25 plus $40 per hour of work.

Let \(C\) = total charge in dollars, and  \(h\) = number of hours worked.

  1. Complete the table of values below that models the relationship between GreenCut's Lawn Services hours worked and total charge.   (1 mark)

    --- 0 WORK AREA LINES (style=lined) ---

    \begin{array}{|c|c|c|c|c|c|c|}
    \hline
    \quad \rule{0pt}{2.5ex}h\quad  \rule[-1ex]{0pt}{0pt}& \quad 0 \quad & \quad 1 \quad &\quad  2\quad  & \quad 3 \quad & \quad 4 \quad & \quad 5 \quad\\
    \hline
    \rule{0pt}{2.5ex}C & & 65 & 105 \rule[-1ex]{0pt}{0pt}& 145 & & 225 \\
    \hline
    \end{array}

  2. Using the table of values from (a), neatly graph the total charge for work completed from 0 to 5 hours on the grid below.   (1 mark)

    --- 0 WORK AREA LINES (style=lined) ---


  3. Using your graph from (b), or otherwise, find the total charge for 2.5 hours of work.   (1 mark)

    --- 2 WORK AREA LINES (style=lined) ---

  4. A customer has a budget of $160. Using your graph from (b), or otherwise, determine the maximum number of complete hours GreenCut can work within this budget.   (1 mark)

    --- 3 WORK AREA LINES (style=lined) ---

Show Answers Only

a.    \(\text{Table of values:}\)

\begin{array}{|c|c|c|c|c|c|c|}
\hline
\quad \rule{0pt}{2.5ex}h\quad  \rule[-1ex]{0pt}{0pt}& \quad 0 \quad & \quad 1 \quad &\quad  2\quad  & \quad 3 \quad & \quad 4 \quad & \quad 5 \quad\\
\hline
\rule{0pt}{2.5ex}C & \textbf{25}& 65 & 105 \rule[-1ex]{0pt}{0pt}& 145 &\textbf{185} & 225 \\
\hline
\end{array}

 
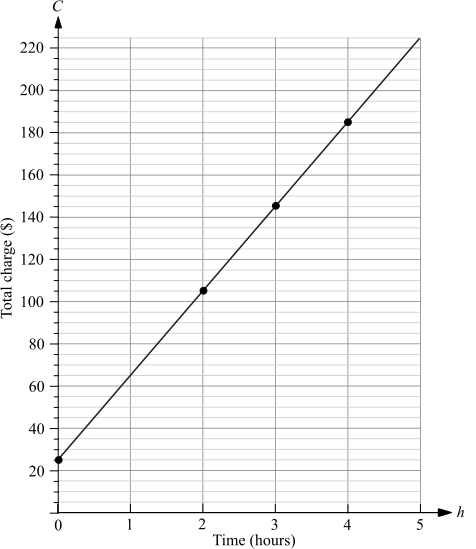
b.    


c.    \($125\)

d.    \(3\ \text{hours}\)

Show Worked Solution

a.    \(\text{Table of values:}\)

\begin{array}{|c|c|c|c|c|c|c|}
\hline
\quad \rule{0pt}{2.5ex}h\quad  \rule[-1ex]{0pt}{0pt}& \quad 0 \quad & \quad 1 \quad &\quad  2\quad  & \quad 3 \quad & \quad 4 \quad & \quad 5 \quad\\
\hline
\rule{0pt}{2.5ex}C & \textbf{25}& 65 & 105 \rule[-1ex]{0pt}{0pt}& 145 &\textbf{185} & 225 \\
\hline
\end{array}

 
b.  


c.    \(\text{From the graph, when }\ h=2.5, \ C=\$125\)
 

d.    \(\text{From the graph, \$160 lies between } h=3 \text{ and } h=4.\)

\(\therefore\ \text{Maximum complete hours} = 3\ \text{hours}\)

Filed Under: Graphs of Practical Situations Tagged With: Band 3, Band 4, smc-6840-05-Linear Graphs

Algebra, STD1 A3 2024 HSC 10 MC

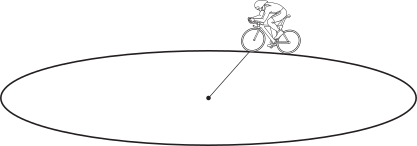
A cyclist rides a bicycle at a constant speed around a circular track.

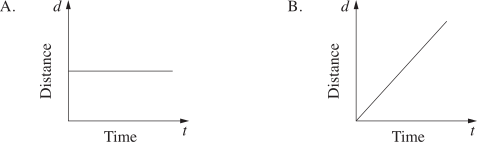
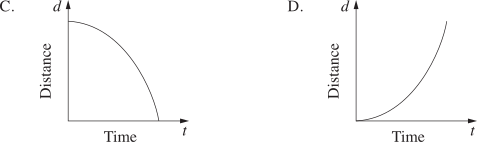
Which of the graphs best illustrates the distance of the cyclist from the centre of the track as time varies?


Show Answers Only

\(A\)

Show Worked Solution

\(\text{The bike rider is always a fixed distance from the centre (length of the radius).}\)

\(\Rightarrow A\)

♦ Mean mark 42%.

Filed Under: A3 Types of Relationships (Y12), Graphs of Practical Situations Tagged With: Band 5, smc-1099-50-Non-linear graphs, smc-6840-05-Linear Graphs

Algebra, STD1 A3 2022 HSC 10 MC

The diagram shows a container, closed at the base. It is to be filled with water at a constant rate.


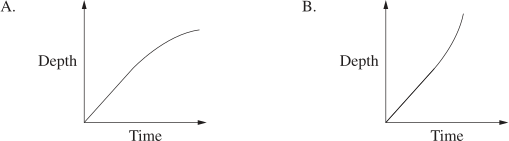
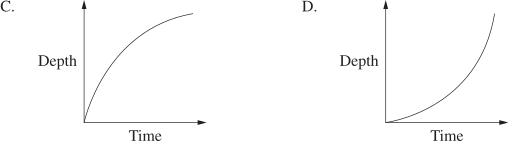
Which graph best shows the depth of water in the container as time varies?


Show Answers Only

\(A\)

Show Worked Solution

\(\text{The container will fill at a constant rate for the cylindrical}\)

\(\text{section of the container → a straight line (linear graph).}\)

\(\text{The container will fill more slowly at a decreasing rate }\)

\(\text{for the conical section of the container → a curved line }\)

\(\text{(non-linear graph).}\)

\(\text{Therefore, }A\ \text{and }B\ \text{are the only options.}\)

\(\text{It cannot be graph}\ B\ \text{as it shows the depth increasing}\)

\(\text{at an increasing rate after the straight line section.}\)

\(\Rightarrow A\)


♦♦♦ Mean mark 24%.

Filed Under: A3 Types of Relationships (Y12), Graphs of Practical Situations Tagged With: Band 6, smc-1099-50-Non-linear graphs, smc-6840-05-Linear Graphs, smc-6840-10-Non-linear Graphs

Algebra, STD1 A3 2021 HSC 25

The diagram shows a container which consists of a small cylinder on top of a larger
cylinder.


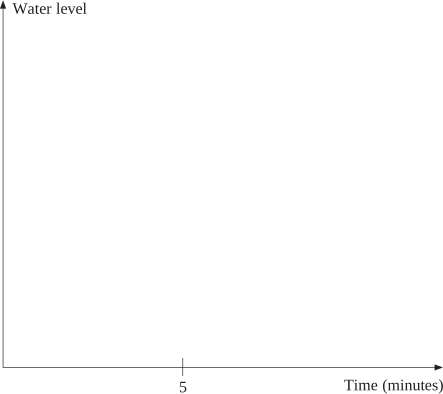
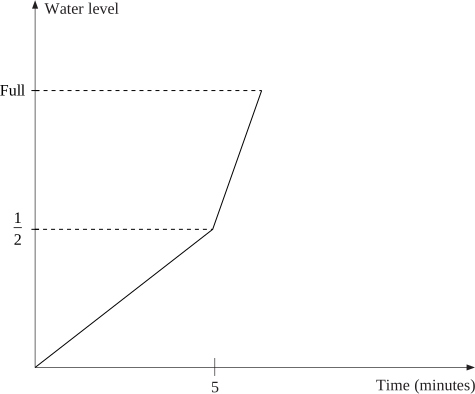
The container is filled with water at a constant rate to the top of the smaller cylinder. It takes 5 minutes to fill the larger cylinder.

Draw a possible graph of the water level in the container against time.   (2 marks)
 

--- 0 WORK AREA LINES (style=lined) ---

Show Answers Only

Show Worked Solution
♦ Mean mark 38%.

Filed Under: A3 Types of Relationships (Y12), Applications of Linear Relationships, Applications of Linear Relationships, Applications: Currency, Fuel and Other Problems, Graphs of Practical Situations Tagged With: Band 5, smc-1099-50-Non-linear graphs, smc-6256-30-Other Linear Applications, smc-6513-30-Other Linear Applications, smc-6840-05-Linear Graphs, smc-793-30-Other Linear Applications

Algebra, STD2 A4 EQ-Bank 2 MC

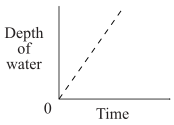
Water was poured into a container at a constant rate. The graph shows the depth of water in the container as it was being filled.


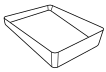
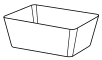
Which of the following containers could have been used to produce this result?

A. B.
C. D.
Show Answers Only

`B`

Show Worked Solution

`text(S)text(ince the graph is a straight line, the cup fills up at)`

`text(a constant rate.)`
 

`=> B`

Filed Under: A3 Types of Relationships (Y12), Applications: Currency, Fuel and Other Problems, Graphs of Practical Situations Tagged With: Band 3, smc-1099-50-Non-linear graphs, smc-6840-05-Linear Graphs, smc-793-30-Other Linear Applications

Copyright © 2014–2026 SmarterEd.com.au · Log in