On the number plane provided below, draw \(y=\cos ^{-1} x+\sin ^{-1} x\) by first drawing \(y=\cos ^{-1} x\) and \(y=\sin ^{-1} x\). (3 marks)
--- 3 WORK AREA LINES (style=lined) ---

Show Answers Only

Show Worked Solution
Aussie Maths & Science Teachers: Save your time with SmarterEd
On the number plane provided below, draw \(y=\cos ^{-1} x+\sin ^{-1} x\) by first drawing \(y=\cos ^{-1} x\) and \(y=\sin ^{-1} x\). (3 marks)
--- 3 WORK AREA LINES (style=lined) ---
What are the domain and range of the function \(y = 2 \cos^{-1}(2x) + 2 \sin^{-1}(2x)\)?
--- 5 WORK AREA LINES (style=lined) --- --- 6 WORK AREA LINES (style=blank) --- a. \(\text{Domain:}\ \ 1 \leqslant x \leqslant 2\) \(\text{Range:}\ \ -2 \pi \leqslant 4 y \leqslant 2 \pi\) b.
Show Answers Only

Which statement is always true for real numbers \(a\) and \(b\) where \(-1 \leqslant a<b \leqslant 1\)?
\(\text{Consider the graph of}\ \ y=\sin^{-1}x \)

\( y=\sin^{-1}x\ \ \text{is an increasing function in range}\ \ -1 \leqslant x \leqslant 1 \)
\(\therefore\ \text{Given}\ \ -1 \leqslant a<b \leqslant 1\ \ \Rightarrow \sin ^{-1} a<\sin ^{-1} b \)
\(\Rightarrow B\)
Which graph represents the function `y = sin^(-1) (sin x)`?
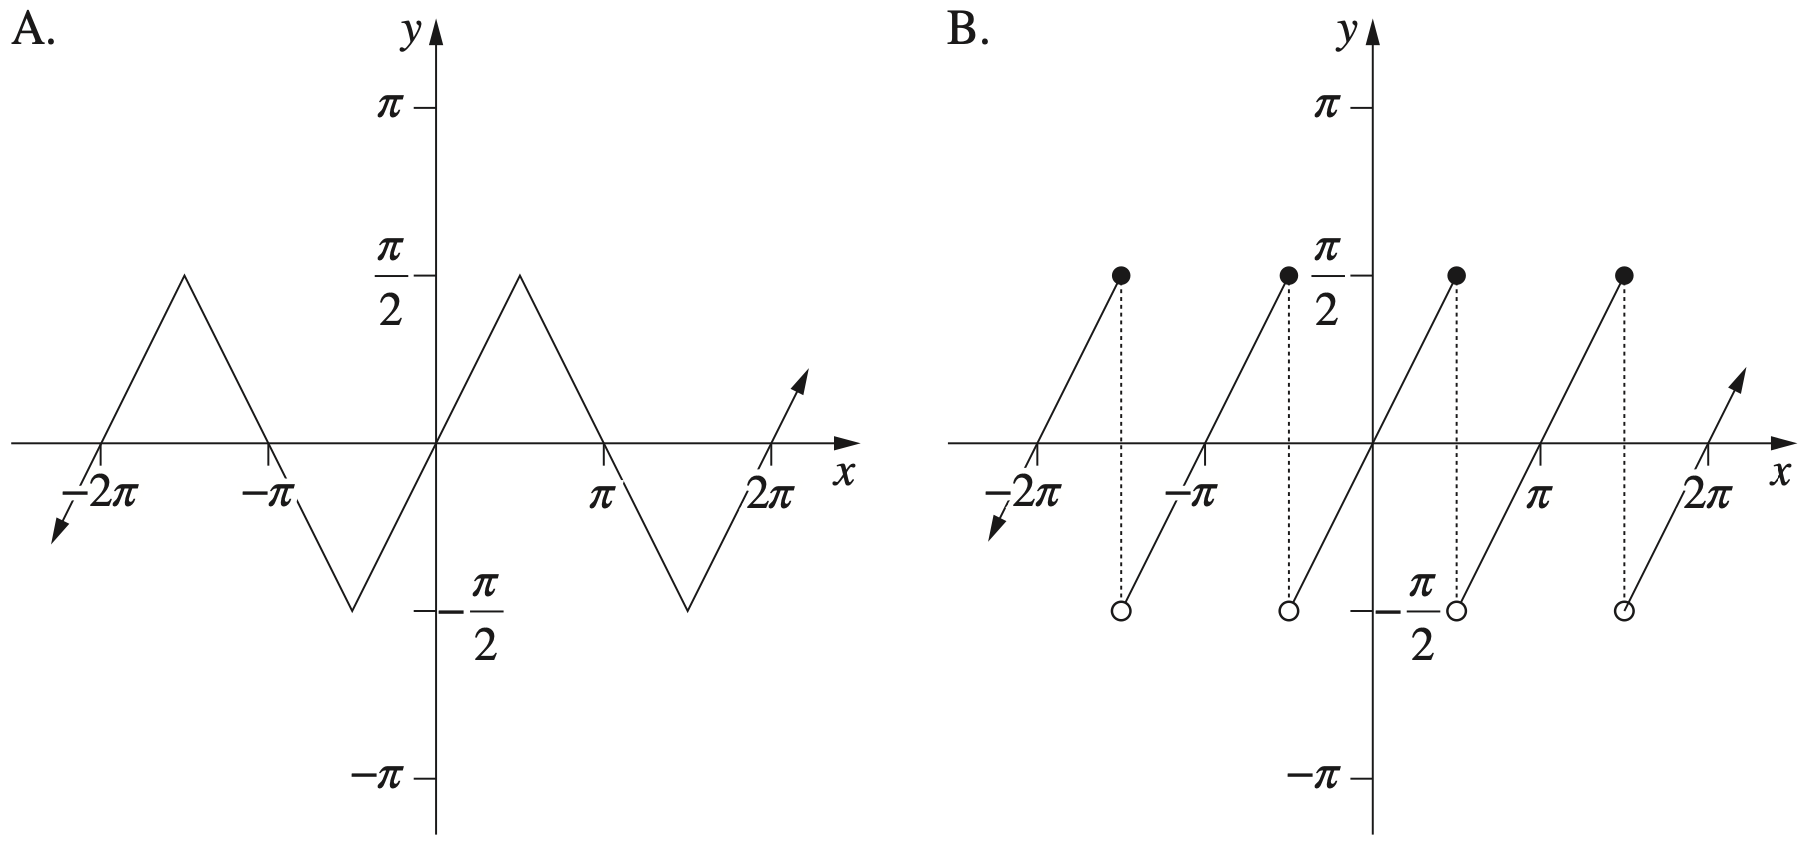
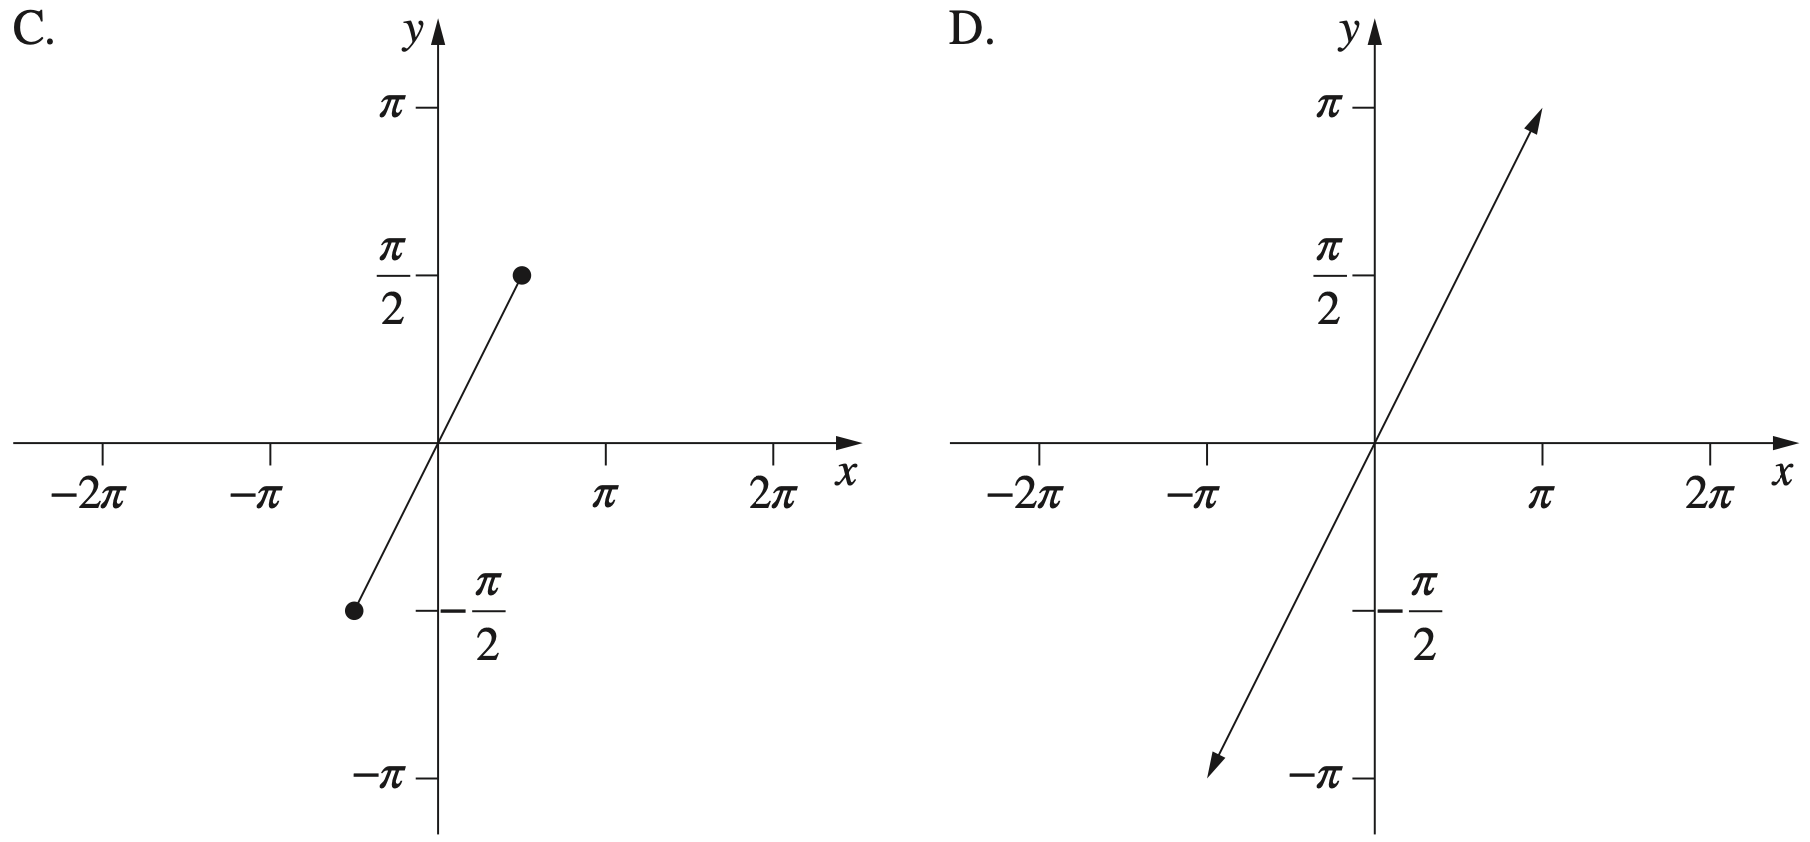
The graph of the function `y = sin^(-1)(x-2)` is transformed by being dilated by a factor of 3 from the `y`-axis and then translated to the right by 2.
What is the equation of the transformed graph?
Let `f(x) = sin^-1 (x + 5).`
--- 4 WORK AREA LINES (style=lined) ---
--- 4 WORK AREA LINES (style=lined) ---
--- 8 WORK AREA LINES (style=lined) ---
a. `text(Domain):\ -6 <= x <= -4, \ \ \ text(Range):\ -pi/2 <= y <= pi/2`
b. `1`
c.

a. `f(x) = sin^-1 (x + 5)`
`text(Domain)`
`-1 <= x + 5 <= 1`
`-6 <= x <= -4`
`text(Range)`
`-pi/2 <= y <= pi/2`
b. `y = sin^-1 (x + 5)`
`(dy)/(dx) = 1/sqrt(1-(x + 5)^2)`
`text(When)\ \ x = -5`
| `(dy)/(dx)` | `= 1/sqrt(1-(-5 + 5)^2)` |
| `= 1/sqrt(1-0)` | |
| `= 1` |
`:.\ text(Gradient of)\ \ y = f(x)\ \ text(at)\ \ x = -5\ \ text(is)\ \ 1.`
|
c. |
|
The diagram shows the graph of a function.

Which function does the graph represent?
Which function best describes the following graph?


