SmarterEd

Aussie Maths & Science Teachers: Save your time with SmarterEd

  • Login
  • Get Help
  • About

CHEMISTRY, M6 2023 HSC 11 MC

An indicator solution was obtained by boiling a flower in water.
 

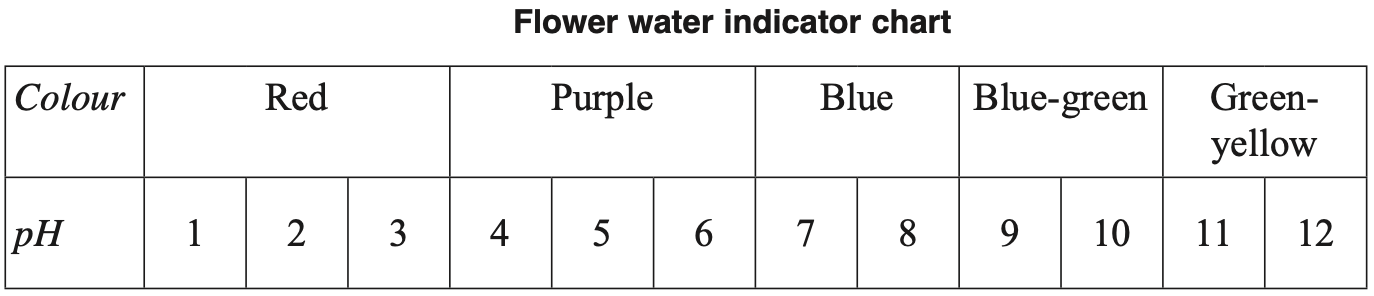
Two solutions were tested with this indicator.

Which row of the table correctly identifies the colour of each solution?
 

  \( \ce{H2SO4} \ (1  \ × \  10^{-5} \ \text{mol  L}^{-1}) \) \( \ce{NaOH}  \ (5 \ × \  10^{-5} \ \text{mol  L}^{-1}) \)
\(\text{A.}\) \( \text{Red} \) \( \text{Green-yellow} \)
\(\text{B.}\) \( \text{Red} \) \( \text{Blue-green} \)
\(\text{C.}\) \( \text{Purple} \) \( \text{Blue-green} \)
\(\text{D.}\) \( \text{Purple} \) \( \text{Green-yellow} \)
Show Answers Only

\(C\)

Show Worked Solution
  • pH can be calculated from the \(\ce{H2SO4}\) and \(\ce{NaOH}\) concentrations, allowing the colour of the solutions to be determined

\(\Rightarrow C\)

Filed Under: Properties of Acids and Bases Tagged With: Band 4, smc-3673-15-Indicators

CHEMISTRY, M6 2018 HSC 29

The concentration of hydrochloric acid in a solution was determined by an acid base titration using a standard solution of sodium carbonate.

  1. Explain why sodium carbonate is a suitable compound for preparation of a standard solution.  (2 marks)

    --- 5 WORK AREA LINES (style=lined) ---

  2. A 25.00 mL sample of 0.1050 mol L¯1 sodium carbonate solution was added to a conical flask and three drops of methyl orange indicator added. The mixture was titrated with the hydrochloric acid and the following readings were recorded.


    Using the data from the table, calculate the concentration of the hydrochloric acid.  (3 marks)

    --- 6 WORK AREA LINES (style=lined) ---

  3. Explain the effect on the calculated concentration of hydrochloric acid if phenolphthalein is used as the indicator instead of methyl orange.  (2 marks)

    --- 5 WORK AREA LINES (style=lined) ---

Show Answers Only

a.    Suitability of  \(\ce{Na2CO3}\):

  • \(\ce{Na2CO3}\) is a stable compound.
  • \(\ce{Na2CO3}\) is a pure solid that will not readily absorb water from the atmosphere.
  • An accurate weight of \(\ce{Na2CO3}\) can therefore be obtained in the experiment’s measurements. 

b.    0.2425 mol L–¹

c.    This is a strong acid / weak base titration.

  • Its equivalence point will occur at a pH less than seven and phenolphthalein changes colour in the pH range 10 – 8.3.
  • Phenolphthalein indicator would therefore signal the end point before equivalence (i.e. with a lower volume of acid). 
  • The calculated concentration of \(\ce{HCl}\) would be higher than the correct concentration.
Show Worked Solution

a.    Suitability of  \(\ce{Na2CO3}\):

  • \(\ce{Na2CO3}\) is a stable compound.
  • \(\ce{Na2CO3}\) is a pure solid that will not readily absorb water from the atmosphere.
  • An accurate weight of \(\ce{Na2CO3}\) can therefore be obtained in the experiment’s measurements. 

♦ Mean mark (a) 43%.

b.   \(\ce{Na2CO3(aq) + 2HCl(aq) -> 2NaCl(aq) + H2O(l) + CO2(g)}\)

\[\ce{Average titre = \frac{21.65 + 21.70 + 21.60}{3} = 21.65 mL}\]

\[\ce{n(Na2CO3) = c \times V = 0.1050 \times 0.0250 = 0.002625 mol}\]

\(\ce{n(HCl) = 2 \times n(Na2CO3) = 0.005250 mol}\)

\[\ce{[HCl] = \frac{n}{V} = \frac{0.005250}{0.02165} = 0.2425 mol L^{-1}}\]  

c.    This is a strong acid / weak base titration.

  • Its equivalence point will occur at a pH less than seven and phenolphthalein changes colour in the pH range 10 – 8.3.
  • Phenolphthalein indicator would therefore signal the end point before equivalence (i.e. with a lower volume of acid). 
  • The calculated concentration of \(\ce{HCl}\) would be higher than the correct concentration.

♦♦♦ Mean mark (c) 29%.

Filed Under: Properties of Acids and Bases, Quantitative Analysis Tagged With: Band 4, Band 5, Band 6, smc-3673-15-Indicators, smc-3675-10-Titration, smc-3675-45-Standard Solutions

CHEMISTRY, M6 2016 HSC 7 MC

Which indicator in the table would be best for distinguishing between lemon juice (pH = 2.3) and potato juice (pH = 5.8)?
 

Show Answers Only

`B`

Show Worked Solution

If Methyl orange is used:

  • Lemon juice would be red, potato juice yellow

`=>B`

Filed Under: Properties of Acids and Bases Tagged With: Band 2, smc-3673-15-Indicators

CHEMISTRY, M6 2015 HSC 21

  1. Outline a suitable method to prepare a natural indicator.   (2 marks)

    --- 6 WORK AREA LINES (style=lined) ---

  2. How could a natural indicator be tested?   (2 marks)

    --- 5 WORK AREA LINES (style=lined) ---

Show Answers Only

a.    Methodology:

  • Collect plant material that is a natural indicator of pH. Examples include rose petals and red cabbage.
  • Cut the coloured parts into small pieces.
  • Place material into a beaker with water and boil until the solution becomes coloured.
  • Allow the mixture to cool at room temperature.
  • Decant the liquid into a container, leaving the solid behind.

b.   Testing a natural indicator:

  • Prepare test tubes of various acids and bases (pH of each is known).
  • Add some of the indicator to each test tube.
  • Record the natural indicator colour of each example and whether it differentiates between acids and bases and their concentrations.
Show Worked Solution

a.    Methodology:

  • Collect plant material that is a natural indicator of pH. Examples include rose petals and red cabbage.
  • Cut the coloured parts into small pieces.
  • Place material into a beaker with water and boil until the solution becomes coloured.
  • Allow the mixture to cool at room temperature.
  • Decant the liquid into a container, leaving the solid behind.

b.   Testing a natural indicator:

  • Prepare test tubes of various acids and bases (pH of each is known).
  • Add some of the indicator to each test tube.
  • Record the natural indicator colour of each example and whether it differentiates between acids and bases and their concentrations.

Filed Under: Properties of Acids and Bases Tagged With: Band 3, Band 4, smc-3673-15-Indicators

CHEMISTRY, M6 2019 HSC 5 MC

The diagram represents the titration curve for a reaction between a particular acid and a particular base. 
 

Which indicator would be best for this titration?

Show Answers Only

`C`

Show Worked Solution
  • The pH range at which isopicramic acid exhibits a colour change includes the point at which the acid and base react in equal amounts (equivalence point), which is at approximately pH 5.
  • The colour change can be used to identify when the equivalence point has been reached in a titration.

`=>C`

Filed Under: Properties of Acids and Bases, Quantitative Analysis Tagged With: Band 3, smc-3673-15-Indicators, smc-3675-20-Titration Curves and Conductivity Graphs

CHEMISTRY, M6 2020 HSC 2 MC

Which indicator in the table would be best for distinguishing between a face cleanser (pH = 5.0) and a soap (pH = 9.0)?
 

Show Answers Only

`C`

Show Worked Solution
  • The phenol red would be yellow for face cleanser (pH of 5.0) and red for soap (pH of 9.0).
  • The other indicators would give off the same colour for both.

`=> C`

Filed Under: Properties of Acids and Bases Tagged With: Band 3, smc-3673-15-Indicators

Copyright © 2014–2025 SmarterEd.com.au · Log in