SmarterEd

Aussie Maths & Science Teachers: Save your time with SmarterEd

  • Login
  • Get Help
  • About

Data Analysis, SM-Bank 053

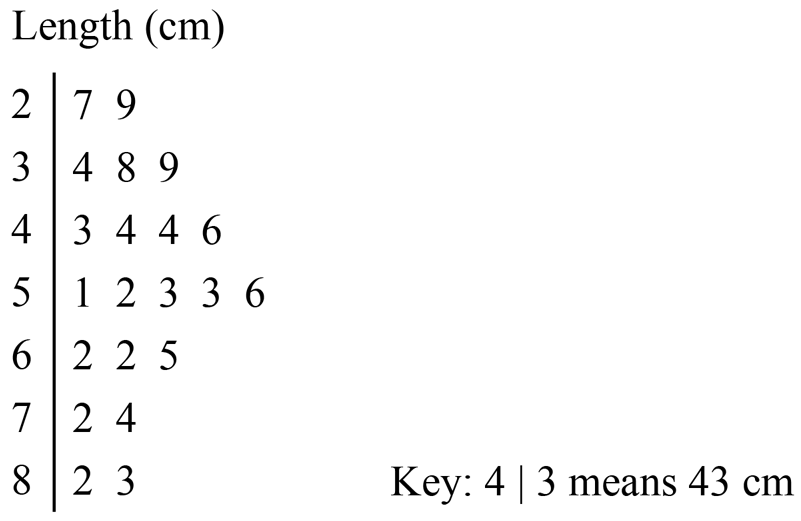
The following ordered stem plot shows the percentage of homes connected to broadband internet for 24 countries in 2007.
 

   CORE, FUR1 2013 VCAA 1-2 MC 
 

  1. How many of these countries had more than 22% of homes connected to broadband internet in 2007?  (1 mark)

    --- 1 WORK AREA LINES (style=lined) ---

  2. What was the median percentage of homes connected to broadband?  (1 mark)

    --- 1 WORK AREA LINES (style=lined) ---

  3. For these countries, what is the modal percentage of homes connected to broadband?  (1 mark)

    --- 5 WORK AREA LINES (style=lined) ---

Show Answers Only

a.    \(19\)

b.    \(29.5\)

c.    \(31\)

Show Worked Solution

a.    \(\text{There are 19 values greater than 22%}\)


b.     \(\text{Median}\) \(=\dfrac{\text{12th + 13th}}{2}\)
    \(=\dfrac{29+30}{2}\)
    \(=29.5\)

 
c.    \(\text{Mode} = 31\)

Filed Under: Data Analysis Tagged With: num-title-ct-core, smc-4224-15-Mode, smc-4224-20-Median, smc-4224-40-Stem and Leaf

Data Analysis, SM-Bank 048 MC

Dante made a dot plot to show the distances he has run in his training for a half-marathon.


What is the median of the distances Dante has run?

  1. \(2\)
  2. \(7\)
  3. \(21\)
  4. \(24\)
Show Answers Only

\(C\)

Show Worked Solution
\(\text{Median}\ \) \(=\ \text{6th score}\)
  \(=21\)

\(\Rightarrow C\)

Filed Under: Data Analysis Tagged With: num-title-ct-core, smc-4224-20-Median

Data Analysis, SM-Bank 042

The following data represents the ages of people on a riverboat cruise in Europe.
 

28,  35,  39,  39,  28,  34,  40,  43,  51,  34,  35,  39,  40,  46,  60


  1. Organise the data into an ordered stem-and-leaf plot.  (2 marks)

    --- 7 WORK AREA LINES (style=lined) ---

  2. What is the median of the ages?  (1 mark)

    --- 1 WORK AREA LINES (style=lined) ---

  3. What is the modal age of the travellers?  (1 mark)

    --- 1 WORK AREA LINES (style=lined) ---

  4. Is this age data skewed or symmetrical?  (1 mark)

    --- 1 WORK AREA LINES (style=lined) ---

Show Answers Only

a.   

\begin{array} {r|lll} \textbf{Stem} & \textbf{Leaf}  \\ \hline  2 & 8\   8 \\  3 & 4\ 4\ 5\ 5 \ 9\ 9\ 9\  \\  4 & 0\ 0\ 3\ 6 \\ 5 & 1 \\ 6 & 0 \\ \end{array}

b.    `39`

c.    `39`

d.    `text(Skewed)`

Show Worked Solution

a.    `text(Ordered data:) \ 28,  28,  34,  34,  35,  35,  39,  39,  39,  40,  40,  43,  46,  51,  60`

\begin{array} {r|lll} \textbf{Stem} & \textbf{Leaf}  \\ \hline  2 & 8\   8 \\  3 & 4\ 4\ 5\ 5 \ 9\ 9\ 9\  \\  4 & 0\ 0\ 3\ 6 \\ 5 & 1 \\ 6 & 0 \\ \end{array}

b.    `text(Median)\ = \text(8th score)\ =\ 39`

c.    `text(Mode)\ = \ 39`

d.    `text(The data is skewed.)`


Filed Under: Data Analysis Tagged With: num-title-ct-core, smc-4224-15-Mode, smc-4224-20-Median, smc-4224-35-Describing datasets, smc-4224-40-Stem and Leaf

Data Analysis, SM-Bank 038

Jason recorded the following marks out of 100 in his last 8 class tests.
 

74,  65,  70,  72,  95,  68,  70,  64
 

  1. Which one of his marks is an outlier?  (1 mark)

    --- 1 WORK AREA LINES (style=lined) ---

  2. If the outlier is removed, by how many marks does the mean change?  (2 marks)

    --- 4 WORK AREA LINES (style=lined) ---

  3. Explain why it would be more appropriate to use the median rather than the mean when including the outlier in Jason's marks.  (2 marks)

    --- 4 WORK AREA LINES (style=lined) ---

Show Answers Only

a.   `95`

b.   `72.25 \-\69 = 3.25\ text(marks)`

c.   “

Show Worked Solution

a.   `text(The test mark of 95 is significantly different from the other marks)`

`:.\  95\ text(is an outlier)`
 

b.  `text(Initial Mean)`

`text(Mean)` `=(74 + 65 + 70 + 72 + 95 + 68 + 70 + 64)/8`  
  `= 578/8`  
  `= 72.25`  

 
`text(Mean without outlier)`

`text(New Mean)` `=(74 + 65 + 70 + 72  + 68 + 70 + 64)/7`
  `= 483/7`
  `= 69`

`:.\ text(The mean decreases by)\ 3.25\ text(marks)`

c.   `text(Ordered marks):\  64, \ 65, \ 68, \  70, \ 70, \ 72, \ 74, \ 95 `

`:.\ text(When 95 is included, the median is 70 where as the mean is 72.25.)`

`72.25\ text(lies between his 6th and 7th scores and is, therefore, not a)`

`text(good measure of centre for Jason’s marks.)`

Filed Under: Data Analysis Tagged With: num-title-ct-core, smc-4224-20-Median, smc-4224-25-Mean, smc-4224-30-Outliers, smc-4224-50-Add/remove data

Data Analysis, SM-Bank 036

The ages of boys competing in an inter-school futsal competition are shown in the frequency distribution table below.
 

\begin{array} {|c|c|}
\hline \textbf{Age (years)} & \textbf{Frequency} \\
\hline 13 & 4 \\
\hline 14 & 6  \\
\hline 15 & 11\\
\hline 16 & 6\\
\hline 17 & 3\\
\hline \end{array} 

  1. How many boys took part in the competition?  (1 mark)

    --- 1 WORK AREA LINES (style=lined) ---

  2. Calculate the mean age of the competitors, correct to the nearest whole number.  (2 marks)

    --- 4 WORK AREA LINES (style=lined) ---

  3. State the median age of the competitors?  (2 marks)

    --- 1 WORK AREA LINES (style=lined) ---

Show Answers Only

\begin{array} {ll} \textbf{a.} &  30 \\ \textbf{b.} & 15 \text{ years} \\ \textbf{c.} & 15 \text{ years} \end{array}

Show Worked Solution
a.   `text(  Number of boys)` `= 4 + 6 + 11 + 6 + 3`
    `= 30`


b.   `text(  Mean age of boys)` `= (13 xx 4 + 14 xx 6 + 15 xx 11 + 16 xx 6 + 17 xx 3)/30`
    `= (52 + 84 + 165 + 96 + 51)/30`
    `= 448/30`
    `= 14.9333…..`
    `~~ 15\ text(years (nearest whole number))`


c.   `text(  Median age of boys )` `=  text(average of 15th and 16th scores)`
    `= 15\ text(years, as both the 15th and 16th scores occur in 15 years)`

Filed Under: Data Analysis Tagged With: num-title-ct-core, smc-4224-20-Median, smc-4224-25-Mean

Data Analysis, SM-Bank 027

Find the median for this set of scores.  (1 mark)

`56, \ 56, \ 59, \ 60, \ 63 \ 64, \ 70, \ 71, \ 72`

--- 1 WORK AREA LINES (style=lined) ---

Show Answers Only

`63`

Show Worked Solution

`text(Median) = text(The middle or 5th score) = 63`

Filed Under: Data Analysis Tagged With: num-title-ct-core, smc-4224-20-Median

Data Analysis, SM-Bank 019

A vet measured the length of 21 dogs that came through his clinic.

The vet recorded the length of each dog.
  

  1.  What is the median length?  (1 mark)

    --- 1 WORK AREA LINES (style=lined) ---

  2. The vet measured and recorded a new dog with a length of 41 centimetres. What is the new median length?  (1 mark)

    --- 2 WORK AREA LINES (style=lined) ---

Show Answers Only

a.   `text(52 cm)`

b.   `text(51.5 cm)`

Show Worked Solution

a.   `text(The median of 21 data points is the 11th data point.)`

`:.\ text(The median is 52 cm.)`


b.   `text(The median of 22 data points is the average of the 11th and 12th data point.)`

`text(Average)` `=(51 +52)/2`
  `=51.5\ text(cm)`

 
`:.\ text(The new median is 51.5 cm.)`

Filed Under: Data Analysis Tagged With: num-title-ct-core, smc-4224-20-Median, smc-4224-40-Stem and Leaf

Data Analysis, SM-Bank 015

A policeman is recording the speed of 25 cars travelling on a highway using a speed gun.

The results are shown in the stem-and-leaf plot.

  1. What is the median speed?  (1 mark)

    --- 2 WORK AREA LINES (style=lined) ---

  2. What is the range of the speeds?  (1 mark)

    --- 2 WORK AREA LINES (style=lined) ---

Show Answers Only

a.   `119\ text(km/hr)`

b.  `49\ text(km/hr)`

Show Worked Solution

a.   `25\ text(data points)`

`text(Median is the 13th data point)`

`:.\ text(Median) = 119\ text(km/hr)`
 

b.   `text(Range)` `= text(Highest) \ – \ text(Lowest)`
    `= 139\ – \ 90`
    `=49\ text(km/hr)`


Filed Under: Data Analysis Tagged With: num-title-ct-core, smc-4224-10-Range, smc-4224-20-Median, smc-4224-40-Stem and Leaf

Data Analysis, SM-Bank 010 MC

The heights, in centimetres, of David's hockey side are displayed in the dot plot below.
 

Which of the following statements is true about this data?

  1. The median and the mode are both 174 and the mean is 174.5.
  2. The mean and the median are both 174 and the mode is 177.
  3. The mean is 175, the mode is 174 and the median is 174.5.
  4. The mean, median and mode are all equal to 174.
Show Answers Only

`D`

Show Worked Solution

`text(Data from the dot plot:)` `\ 171, \ 172, \ 172, \ 173, \ 174, \ 174, \ 174, \ 174, \ 176, \ 177, \ 177`

`text(Median)\ ` `=\ text(Middle or 6th score)`
  `= 174`


`text(Mode)\ ` `=\ text(The most frequent score)`
  `= 174`


`text(Mean)\ ` `=\ text(Average of the scores)`
  `= (171 + 172 + 172 + 173 + 174 + 174 + 174 + 174 + 176 + 177 + 177)/11`
  `= 1914/11`
  `= 174`

 
∴ The mean, median and mode are all equal to 174.

`=>D`

Filed Under: Data Analysis Tagged With: num-title-ct-core, smc-4224-15-Mode, smc-4224-20-Median, smc-4224-25-Mean, smc-4224-45-Mean/median/mode/range

Data Analysis, SM-Bank 008 MC

A group of friends met with their 7 children. The ages of the children were:

 `9, \ 4, \ 5, \ 6, \ 11, \ 3, \ 4`

The median of the children's ages is:

  1. `6`
  2. `5`
  3. `4`
  4. `8`
Show Answers Only

`B`

Show Worked Solution

`text(Ordered data:)` `\ 3, \ 4, \ 4, \ 5, \ 6, \ 9, \ 11`

`text(Median)\ ` `=\ text(Middle score)`
  `=5`

 
`=>B`

Filed Under: Data Analysis Tagged With: num-title-ct-core, smc-4224-20-Median

Data Analysis, SM-Bank 007

Bailey's soccer coach recorded the number of goals scored during the last 6 games of the season.

  `3, \ 7, \ 6, \ 3, \ 1, \ 4`

Find:

  1. the median number of goals scored.  (1 mark)

    --- 2 WORK AREA LINES (style=lined) ---

  2. the mean number of goals scored.  (1 mark)

    --- 2 WORK AREA LINES (style=lined) ---

Show Answers Only

i.  `3.5`

ii.  `4`

Show Worked Solution

i.  `text(Ordered data:)` `\ 1, \ 3, \ 3, \ 4, \ 6, \ 7`

`text(Median)\ ` `=\ text(Average of 2 middle scores)`
  `= (3+4)/2`
  `= 7/2`
  `=3.5`


ii.  `text(Mean) ` `= (3+7+6+3+1+4)/6`  
  `= 24/6`  
  `= 4`  


Filed Under: Data Analysis Tagged With: num-title-ct-core, smc-4224-20-Median, smc-4224-25-Mean

Data Analysis, SM-Bank 004 MC

Jacqui's basketball team has 5 players.

The height of each player is listed below (in cm):
 

`186, 190, 164, 190, 175`
  

What is the median height of these players?

  1. `181\ text(cm)`
  2. `164\ text(cm)`
  3. `186\ text(cm)`
  4. `190\ text(cm)`
Show Answers Only

`C`

Show Worked Solution

`text(Heights in order are:)`

`164, 175, 186, 190, 190`

`:.\ text(Median) = 186\ text(cm)`

`=> C`

Filed Under: Data Analysis Tagged With: num-title-ct-core, smc-4224-20-Median

Data Analysis, SM-Bank 003

This table shows the number of people who visited a war memorial on weekdays over 4 weeks.


  1. What was the range of people visiting the war memorial on Monday?  (1 mark)

    --- 1 WORK AREA LINES (style=lined) ---

  2. What was the mean number of people who attended the war memorial on Fridays?  (1 mark)

    --- 1 WORK AREA LINES (style=lined) ---

  3. What was the median number of people who visited the war memorial during week 3?  (1 mark)

    --- 1 WORK AREA LINES (style=lined) ---

  4. What is the modal number of visitors to the war memorial during the four week period?  (1 mark)

    --- 1 WORK AREA LINES (style=lined) ---

Show Answers Only

a.   `44`

b.   `26`

c.   `39`

d.   `22`

Show Worked Solution
a.   `text(Range on Mondays)` `= 81 \ -\ 37`
  `= 44`


b.   `text(Mean on Fridays)` `=(22 + 32+28+22)/4`
  `=104/4`
  `=26`

  
c.   `text(Week 3 data in order:   28,  37,  39,  53,  72)`

`text(Median Week 3)` `=\ text(middle score)`
  `=\  39`

 
d.   `text(Modal number of visitors) = 22`

Filed Under: Data Analysis Tagged With: num-title-ct-core, smc-4224-10-Range, smc-4224-15-Mode, smc-4224-20-Median, smc-4224-25-Mean

Statistics, STD2 S1 2006 HSC 4 MC

A set of scores is displayed in a stem-and-leaf plot.
 

 2UG-2006-4MC

 
What is the median of this set of scores?

  1.   28
  2.   30
  3.   33
  4.   47
Show Answers Only

`C`

Show Worked Solution

`text(10 scores)`

`text(Median)` `= text{5th + 6th}/2`
  `= (28 + 38)/2`
  `= 33`

`=>  C`

Filed Under: Bar Charts, Histograms and Other Graphs (Std 1), Other Chart Types (Y12), Other Charts (Std 2), Other Charts (Std2-2027), Stem & Leaf, Box & Whisker Tagged With: Band 4, common-content, num-title-ct-core, num-title-qs-hsc, smc-1128-24-Stem and Leaf, smc-4224-20-Median, smc-4224-40-Stem and Leaf, smc-6311-10-Stem-and-Leaf, smc-822-20-Stem and Leaf, smc-998-20-Stem and Leaf

Statistics, STD2 S1 2008 HSC 8 MC

What is the median of the following set of scores?


  1.    12
  2.    13
  3.    14
  4.    15
Show Answers Only

`C`

Show Worked Solution
`text(Median` `=(n+1)/2`
  `=(33+1)/2`
  `=\ text (17th score)`


`:.\ text(Median is 14)`

`=>  C`

Filed Under: Data Analysis, Measures of Centre and Spread (Std2-2027), Summary Statistics - No Graph (Std 2), Summary Statistics - No graph (Y12), Summary Statistics (no graph), Summary Statistics (Std 1) Tagged With: Band 4, common-content, num-title-ct-core, num-title-qs-hsc, smc-1131-20-Median and Mode, smc-1131-60-Frequency Tables, smc-4224-20-Median, smc-6312-20-Median and Mode, smc-6312-60-Frequency Tables, smc-824-20-Median and Mode, smc-824-60-Frequency Tables, smc-999-20-Median and Mode

Statistics, STD2 S1 2011 HSC 14 MC

A data set of nine scores has a median of 7.

The scores  6, 6, 12 and 17  are added to this data set.

What is the median of the data set now?

  1. 6
  2. 7
  3. 8
  4. 9
Show Answers Only

`B`

Show Worked Solution

`text(S)text(ince an even amount of scores are added below and)`

`text(above the existing median, it will not change.)`

`=>B`

Filed Under: Data Analysis, Measures of Centre and Spread (Std2-2027), Summary Statistics - No Graph (Std 2), Summary Statistics - No graph (Y12), Summary Statistics (no graph), Summary Statistics (Std 1) Tagged With: Band 4, common-content, num-title-ct-core, num-title-qs-hsc, smc-1131-20-Median and Mode, smc-4224-20-Median, smc-4224-50-Add/remove data, smc-6312-20-Median and Mode, smc-824-20-Median and Mode, smc-999-20-Median and Mode

Statistics, STD2 S1 2013 HSC 26f

Jason travels to work by car on all five days of his working week, leaving home at 7 am each day. He compares his travel times using roads without tolls and roads with tolls over a period of 12 working weeks.

He records his travel times (in minutes) in a back-to-back stem-and-leaf plot.
 

2013 26f
 

  1. What is the modal travel time when he uses roads without tolls?  (1 mark)

    --- 1 WORK AREA LINES (style=lined) ---

  2. What is the median travel time when he uses roads without tolls?   (1 mark)

    --- 1 WORK AREA LINES (style=lined) ---

  3. Describe how the two data sets differ in terms of the spread and skewness of their distributions.   (2 marks)

    --- 5 WORK AREA LINES (style=lined) ---

Show Answers Only
  1. `52\ text(minutes)`
  2. `50.5\ text(minutes)`
  3. `text(Spread)`
  4. `text{Times without tolls have a tighter spread (range = 22)}`
  5. `text{than times with tolls (range = 55).}`
  6.  

    `text(Skewness)`

  7. `text(Times without tolls shows virtually no skewness while`
  8. `text(times with tolls are positively skewed.)`
Show Worked Solution

i.  `text(Modal time) = 52\ text(minutes)`

♦ Mean mark 36%
MARKER’S COMMENT: Finding a median proved challenging for many students. Take note!


ii.  `text(30 times with no tolls)`

`text(Median)` `=\ text(Average of 15th and 16th)`
  `=(50 + 51)/2`
  `= 50.5\ text(minutes)`


♦ Mean mark 39%


 iii.  `text(Spread)`

`text{Times without tolls have a much tighter}`

`text{spread (range = 22) than times with tolls}`

`text{(range = 55).}`

`text(Skewness)`

`text(Times without tolls shows virtually no skewness)`

`text(while times with tolls are positively skewed.)`

Filed Under: Bar Charts, Histograms and Other Graphs (Std 1), Data Analysis, Other Chart Types (Y12), Other Charts (Std 2), Other Charts (Std2-2027), Stem & Leaf, Box & Whisker Tagged With: Band 4, Band 5, num-title-ct-core, num-title-qs-hsc, smc-1128-24-Stem and Leaf, smc-4224-15-Mode, smc-4224-20-Median, smc-4224-35-Describing datasets, smc-4224-40-Stem and Leaf, smc-6311-20-Back-to-Back Stem-and-Leaf, smc-822-30-Back-to-Back Stem and Leaf, smc-998-30-Back-to-Back Stem and Leaf

Statistics, STD2 S1 2010 HSC 16 MC

This back-to-back stem-and-leaf plot displays the test results for a class of 26 students.
 

2010 Q16 MC  
 

What is the median test result for the class?

  1.    `44`
  2.    `46`
  3.    `48`
  4.    `49`
Show Answers Only

`B`

Show Worked Solution
♦♦ Mean mark 35%

`text(26 results given in the data)`

  `=>text(Median is average of)\ 13^text(th)\ text(and)\ 14^text(th)`

`:.\ text(Median)` `=(45+47)/2`
  `=46`

`=>B`

Filed Under: Bar Charts, Histograms and Other Graphs (Std 1), Data Analysis, Other Chart Types (Y12), Other Charts (Std 2), Other Charts (Std2-2027), Stem & Leaf, Box & Whisker Tagged With: Band 5, num-title-ct-core, num-title-qs-hsc, smc-1128-26-Back-to-back Stem and Leaf, smc-4224-20-Median, smc-4224-40-Stem and Leaf, smc-6311-20-Back-to-Back Stem-and-Leaf, smc-822-30-Back-to-Back Stem and Leaf, smc-998-30-Back-to-Back Stem and Leaf

Statistics, STD2 S1 2009 HSC 24a

The diagram below shows a stem-and-leaf plot for 22 scores. 
 

2UG-2009-24a
 

  1.  What is the mode for this data?   (1 mark)

    --- 1 WORK AREA LINES (style=lined) ---

  2.  What is the median for this data?     (1 mark)

    --- 1 WORK AREA LINES (style=lined) ---

Show Answers Only
  1. `78`
  2. `46`
Show Worked Solution

i.   `text(Mode) = 78`


ii.    `22\ text(scores)`

`=>\ text(Median is the average of 11th and 12th scores)`
 

`:.\ text(Median)` `= (45 + 47)/2`
  `= 46`

Filed Under: Bar Charts, Histograms and Other Graphs (Std 1), Data Analysis, Other Chart Types (Y12), Other Charts (Std 2), Other Charts (Std2-2027), Stem & Leaf, Box & Whisker Tagged With: Band 3, Band 4, common-content, num-title-ct-core, num-title-qs-hsc, smc-1128-24-Stem and Leaf, smc-4224-15-Mode, smc-4224-20-Median, smc-4224-40-Stem and Leaf, smc-6311-10-Stem-and-Leaf, smc-822-20-Stem and Leaf, smc-998-20-Stem and Leaf

Statistics, STD2 S1 2012 HSC 1 MC

A set of 15 scores is displayed in a stem-and-leaf plot.
 

2012 1 mc 
 

 What is the median of these scores?

  1.    7 
  2.    8
  3.   77
  4.   78
Show Answers Only

`D`

Show Worked Solution

`text(15 scores)\ \ =>\ \ text(Median is 8th)`

`:.\ \ text(Median is)\ \ 78`

`=>  D`

Filed Under: Bar Charts, Histograms and Other Graphs (Std 1), Data Analysis, Other Chart Types (Y12), Other Charts (Std 2), Other Charts (Std2-2027), Stem & Leaf, Box & Whisker Tagged With: Band 4, common-content, num-title-ct-core, num-title-qs-hsc, smc-1128-24-Stem and Leaf, smc-4224-20-Median, smc-4224-40-Stem and Leaf, smc-6311-10-Stem-and-Leaf, smc-822-20-Stem and Leaf, smc-998-20-Stem and Leaf

Copyright © 2014–2025 SmarterEd.com.au · Log in