SmarterEd

Aussie Maths & Science Teachers: Save your time with SmarterEd

  • Login
  • Get Help
  • About

Algebra, STD2 A4 2021 HSC 24

A population, `P`,  is to be modelled using the function  `P = 2000 (1.2)^t`, where `t` is the time in years.

  1. What is the initial population?   (1 mark)

    --- 2 WORK AREA LINES (style=lined) ---

  2. Find the population after 5 years.   (1 mark)

    --- 2 WORK AREA LINES (style=lined) ---

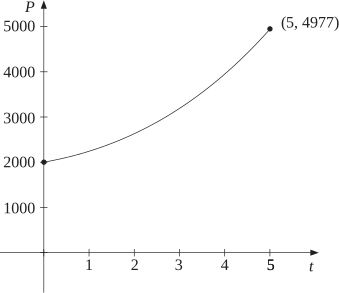
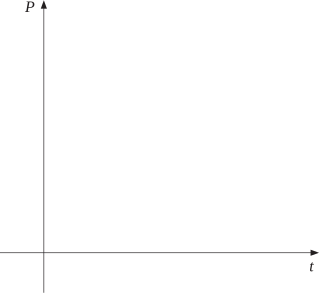
  3. On the axes below, draw the graph of the population against time, showing the points at  `t = 0`  and at  `t = 5`.   (2 marks)
      

    --- 0 WORK AREA LINES (style=lined) ---

Show Answers Only

a.    `2000`

b.    `4977`

c.    `text{See Worked Solutions}`

Show Worked Solution

a.    `text{Initial population occurs when}\ \  t = 0:`

`P= 2000 (1.2)^0= 2000`
 

b.    `text{Find} \ P \ text{when} \ \ t = 5: `

`P` `= 2000 (1.2)^5`
  `= 4976.64`
  `= 4977 \ text{(nearest whole)}`


♦ Mean mark (c) 48%.

c. 

Filed Under: Exponential Functions, Exponentials, Non-Linear: Exponential/Quadratics Tagged With: Band 3, Band 4, Band 5, num-title-ct-coreb, num-title-qs-hsc, smc-4444-40-Population, smc-6921-10-\(\large y=ka^{x}\), smc-6921-30-Draw Graphs, smc-830-30-Exponential

Algebra, STD1 A3 2020 HSC 19

Each year the number of fish in a pond is three times that of the year before.

  1. The table shows the number of fish in the pond for four years.
    \begin{array} {|l|c|c|c|c|}
    \hline
    \rule{0pt}{2.5ex}\textit{Year}\rule[-1ex]{0pt}{0pt} & \ \ \ 2020\ \ \  & \ \ \ 2021\ \ \  & \ \ \ 2022\ \ \  & \ \ \ 2023\ \ \ \\
    \hline
    \rule{0pt}{2.5ex}\textit{Number of fish}\rule[-1ex]{0pt}{0pt} & 100 & & & 2700\\
    \hline
    \end{array}

    Complete the table above showing the number of fish in 2021 and 2022.   (2 marks)
     

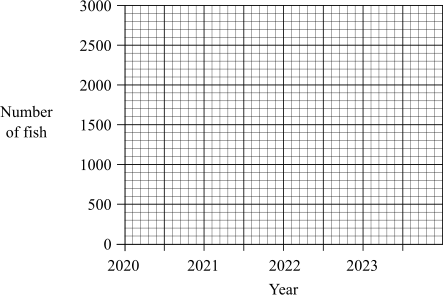
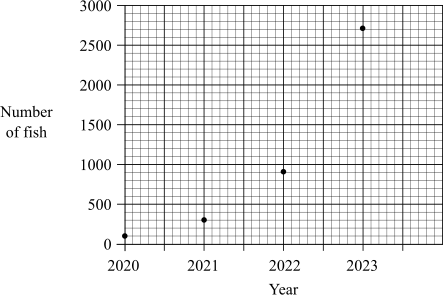
  2. Plot the points from the  table in part (a) on the grid.   (2 marks)
     
  3. Which model is more suitable for this dataset: linear or exponential? Briefly explain your answer.   (2 marks)

    --- 4 WORK AREA LINES (style=lined) ---

Show Answers Only

a.   

\begin{array} {|l|c|c|c|c|}
\hline
\rule{0pt}{2.5ex}\textit{Year}\rule[-1ex]{0pt}{0pt} & \ \ \ 2020\ \ \  & \ \ \ 2021\ \ \  & \ \ \ 2022\ \ \  & \ \ \ 2023\ \ \ \\
\hline
\rule{0pt}{2.5ex}\textit{Number of fish}\rule[-1ex]{0pt}{0pt} & 100 & 300 & 900 & 2700\\
\hline
\end{array}

b.   
       

c.    \(\text{The more suitable model is exponential.}\)

\(\text{A linear dataset would graph a straight line which is}\)

\(\text{not the case here.}\)

\(\text{An exponential curve can be used to graph populations that }\)

\(\text{grow at an increasing rate, such as this example.}\)

Show Worked Solution

a.        

\begin{array} {|l|c|c|c|c|}
\hline
\rule{0pt}{2.5ex}\textit{Year}\rule[-1ex]{0pt}{0pt} & \ \ \ 2020\ \ \  & \ \ \ 2021\ \ \  & \ \ \ 2022\ \ \  & \ \ \ 2023\ \ \ \\
\hline
\rule{0pt}{2.5ex}\textit{Number of fish}\rule[-1ex]{0pt}{0pt} & 100 & 300 & 900 & 2700\\
\hline
\end{array}

b.  

c.    \(\text{The more suitable model is exponential.}\)

\(\text{A linear dataset would graph a straight line which is}\)

\(\text{not the case here.}\)

\(\text{An exponential curve can be used to graph populations that }\)

\(\text{grow at an increasing rate, such as this example.}\)

♦♦ Mean mark (c) 31%.

Filed Under: A3 Types of Relationships (Y12), Exponentials, Graphs of Practical Situations Tagged With: Band 3, Band 5, num-title-ct-coreb, num-title-qs-hsc, smc-1099-50-Non-linear graphs, smc-4444-40-Population, smc-6840-10-Non-linear Graphs

Copyright © 2014–2026 SmarterEd.com.au · Log in