Let `y=f(x)` be a function defined for `0 <= x <= 6`, with `f(0)=0`.
The diagram shows the graph of the derivative of `f`, `y = f^{prime}(x)`.

The shaded region `A_1` has area 4 square units. The shaded region `A_2` has area 4 square units.
- For which values of `x` is `f(x)` increasing? (1 mark)
--- 2 WORK AREA LINES (style=lined) ---
- What is the maximum value of `f(x)`? (1 mark)
--- 3 WORK AREA LINES (style=lined) ---
- Find the value of `f(6)`. (1 mark)
--- 3 WORK AREA LINES (style=lined) ---
- Draw a graph of `y =f(x)` for `0 <= x <= 6`. (2 marks)
--- 8 WORK AREA LINES (style=lined) ---
Show Answers Only
a. `f(x)\ text(is increasing when)\ 0 <= x < 2`
b. `text(MAX value of)\ f(x) = 4`
c. `-6`
d.
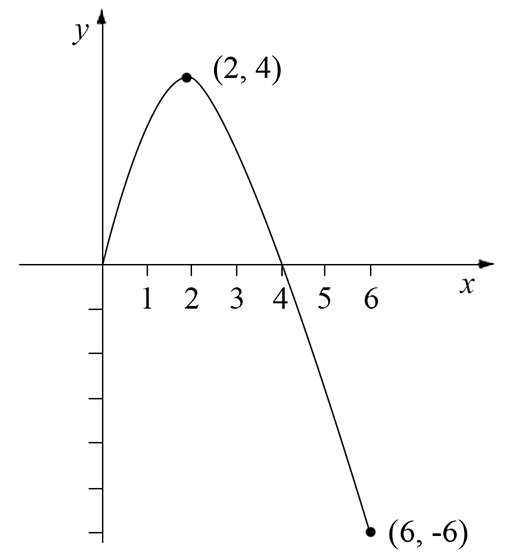
Show Worked Solution
| a. | `f(x)\ text(is increasing when)\ \ f^{prime}(x) > 0` |
| `text(From the graph)` | |
| `f(x)\ text(is increasing when)\ 0 <= x < 2` |
| b. | `f^{prime}(x) = 0\ \ text(when)\ \ x=2` |
| `:.\ text(MAX at)\ \ x = 2` | |
| `int_0^2 f^{prime}(x)\ dx = 4\ \ \ (text(given since)\ A_1 = 4 text{)}` | |
| `text(We also know)` |
| `int_0^2\ f^{prime}(x)\ dx` | `= [f(x)]_0^2` |
| `= f(2)-f(0)` | |
| `= f(2)\ \ \ \ text{(since}\ f(0) = 0 text{)}` |
`=> f(2) = 4`
♦♦♦ Parts (b) and (c) proved particularly difficult for students with mean marks of 12% and 11% respectively.
`:.\ text(MAX value of)\ \ f(x) = 4`
| c. | `int_0^4 f^{prime}(x)` | `= A_1-A_2` |
| `=0` |
`text(We also know)`
| `int_0^4 f^{prime}(x)\ dx` | `= int_2^4 f^{prime}(x)\ dx + int_0^2 f^{prime}(x)\ dx` |
| `=[f(x)]_2^4 + 4` | |
| `= f(4)-f(2) + 4\ \ \ (text(note)\ f(2)=4)` | |
| `=f(4)` |
`=> f(4) = 0`
`text(Gradient)=-3\ text(from)\ \ x = 4\ \ text(to)\ \ x = 6`
| `:.\ f(6)` | `=-3 (6- 4)` |
| `=-6` |
♦♦ Mean mark (d) 28%
EXAM TIP: Clearly identify THE EXTREMES when given a defined domain. In this case, the origin is obvious graphically, and the other extreme at `x=6`, is CLEARLY LABELLED!
EXAM TIP: Clearly identify THE EXTREMES when given a defined domain. In this case, the origin is obvious graphically, and the other extreme at `x=6`, is CLEARLY LABELLED!
| d. | |