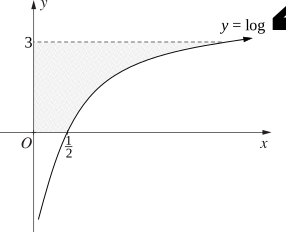
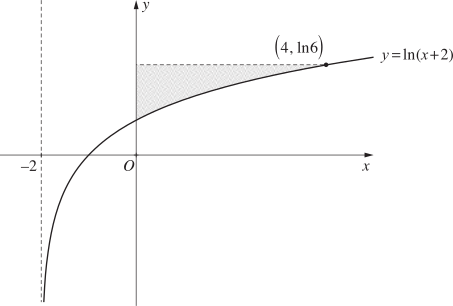
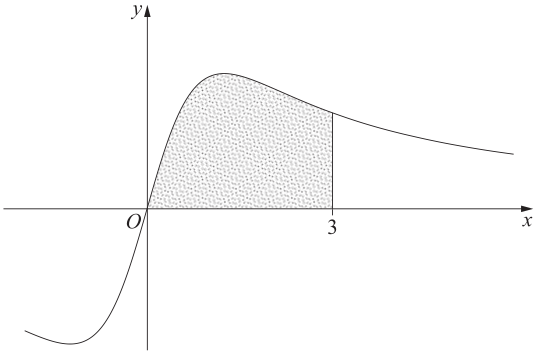
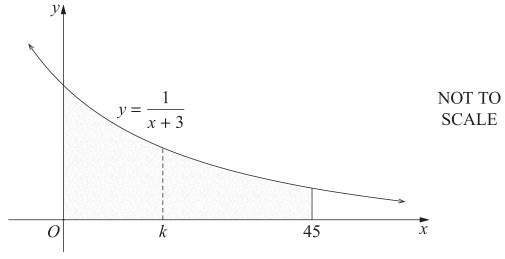
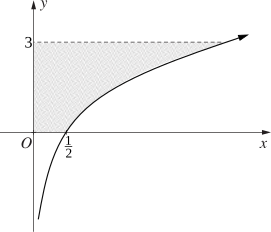
The diagram shows the graph of \(y=\log _e(x+1)\)
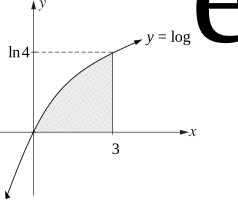
- Express \(x\) as a function of \(y\). (1 mark)
--- 2 WORK AREA LINES (style=lined) ---
- Hence, or otherwise, find the exact area of the shaded region bounded by the curve \(y=\log _e(x+1)\), the \(x\)-axis, and the line \(x=3\). (3 marks)
--- 10 WORK AREA LINES (style=lined) ---