SmarterEd

Aussie Maths & Science Teachers: Save your time with SmarterEd

  • Login
  • Get Help
  • About

Statistics, STD2 S1 2022 HSC 15 MC

The cumulative frequency graph shows the distribution of the number of movie downloads made by 100 people in one month.
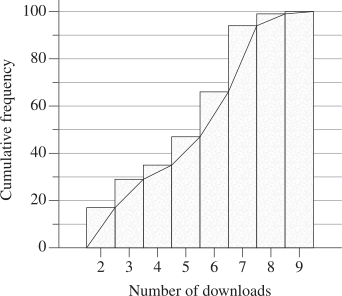
 

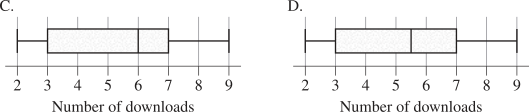
Which box-plot best represents the same data as displayed in the cumulative frequency graph?
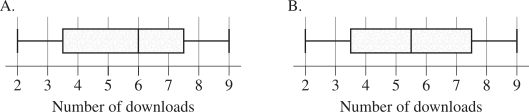
 

Show Answers Only

`C`

Show Worked Solution

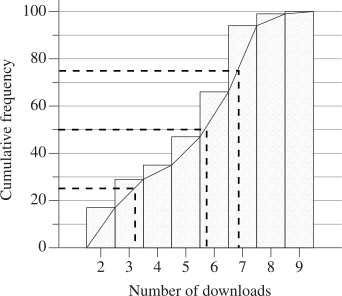
`text{1st quartile}\ ~~ 3`

`text{Median}\ ~~ 6`

`text{3rd quartile}\ ~~ 7`

`=>C`


♦♦♦ Mean mark 30%.

Filed Under: Bar Charts and Histograms, Displaying Data - Bar Charts and Histograms, Summary Statistics - Box Plots, Summary Statistics - Box Plots Tagged With: Band 6, common-content, smc-6310-30-Cumulative Frequency Histograms, smc-6310-40-IQR, smc-6313-10-Single Box Plots, smc-821-20-Cumulative Frequency Histograms, smc-821-30-IQR, smc-825-10-Single Box-Plots

Statistics, STD2 S1 2016 HSC 27c

The heights of 400 students were measured. The results are displayed in this cumulative frequency polygon.
 

2ug-2016-hsc-q27_2

 
Use the polygon to estimate the interquartile range.   (2 marks)

--- 4 WORK AREA LINES (style=lined) ---

Show Answers Only

`36\ text(cm)`

Show Worked Solution

`text(See graph for values:)`

♦ Mean mark 46%.

2ug-2016-hsc-q27c-answer

`IQR= Q_3-Q_1= 172-136=36\ text(cm)`

Filed Under: Bar Charts and Histograms, Bar Charts and Histograms, Bar Charts and Histograms, Bar Charts, Histograms and Other Graphs, Displaying Data - Bar Charts and Histograms, Displaying Data - Bar Charts and Histograms Tagged With: Band 5, common-content, smc-1128-20-Cumulative Frequency Histograms, smc-1128-30-IQR, smc-6310-30-Cumulative Frequency Histograms, smc-6310-40-IQR, smc-6530-30-Cumulative Frequency Histograms, smc-6530-40-IQR, smc-821-20-Cumulative Frequency Histograms, smc-821-30-IQR, smc-997-20-Cumulative Frequency Histograms, smc-997-30-IQR

Statistics, STD2 S1 2005 HSC 9 MC

A set of data is represented by the cumulative frequency histogram and ogive.
 

2UG-2005-9MC
 

What is the best approximation for the interquartile range for this set of data?

  1. 25
  2. 30
  3. 35
  4. 40
Show Answers Only

`C`

Show Worked Solution

2UG-2005-9MC Answer

`IQR= Q3-Q1= 80-45= 35`

`=>  C`

Filed Under: Bar Charts and Histograms, Bar Charts and Histograms, Bar Charts and Histograms, Bar Charts, Histograms and Other Graphs, Displaying Data - Bar Charts and Histograms, Displaying Data - Bar Charts and Histograms Tagged With: Band 5, common-content, smc-1128-20-Cumulative Frequency Histograms, smc-1128-30-IQR, smc-6310-30-Cumulative Frequency Histograms, smc-6310-40-IQR, smc-6530-30-Cumulative Frequency Histograms, smc-6530-40-IQR, smc-821-20-Cumulative Frequency Histograms, smc-821-30-IQR, smc-997-20-Cumulative Frequency Histograms, smc-997-30-IQR

Statistics, STD2 S1 2013 HSC 27c

A retailer has collected data on the number of televisions that he sold each week in 2012.

He grouped the data into classes and displayed the data using a cumulative frequency histogram and polygon (ogive).
 

2013 27c

  1. Use the cumulative frequency polygon to determine the interquartile range.   (2 marks)

    --- 4 WORK AREA LINES (style=lined) ---

  2. Oscar said that the retailer sold 300 televisions in 6 of the weeks in 2012.


    Is he correct? Give a reason for your answer.   (1 mark)

    --- 2 WORK AREA LINES (style=lined) ---

Show Answers Only

a.    `280`

b.    `text(Oscar is not correct because the data is grouped.)`

`text(He could only say that the retailer sold between 250`

`text(and 350 units in 6 of the weeks in 2012.)`

Show Worked Solution

a.  `text(S)text(ince cumulative frequency = 52 at max)`

♦♦♦ Mean mark 13%
COMMENT: Finding median and quartile values from cumulative frequency charts is an important skill that is often examined.

`=> text(Lower quartile at week) = 52/4 = 13`

`text(Lower quartile = 190)\ \ \ \ text{(from graph)}`

`=> text(Upper quartile at week) = 3 xx 13 = 39`

`text(Upper quartile = 470)`

`:.\ text(IQR)= 470-190=280` 
  

b.   `text(Oscar is not correct because the data is grouped.)`

♦♦♦ This question proved a beast, with a mean mark of 1%. Toughest question in the 2013 exam!

`text(He could only say the retailer sold between)`

`text(250 and 350 units in 6 of the weeks in 2012.)`

Filed Under: Bar Charts and Histograms, Bar Charts and Histograms, Bar Charts and Histograms, Displaying Data - Bar Charts and Histograms Tagged With: Band 6, common-content, smc-6310-30-Cumulative Frequency Histograms, smc-6310-40-IQR, smc-821-20-Cumulative Frequency Histograms, smc-821-30-IQR, smc-997-20-Cumulative Frequency Histograms, smc-997-30-IQR

Copyright © 2014–2026 SmarterEd.com.au · Log in