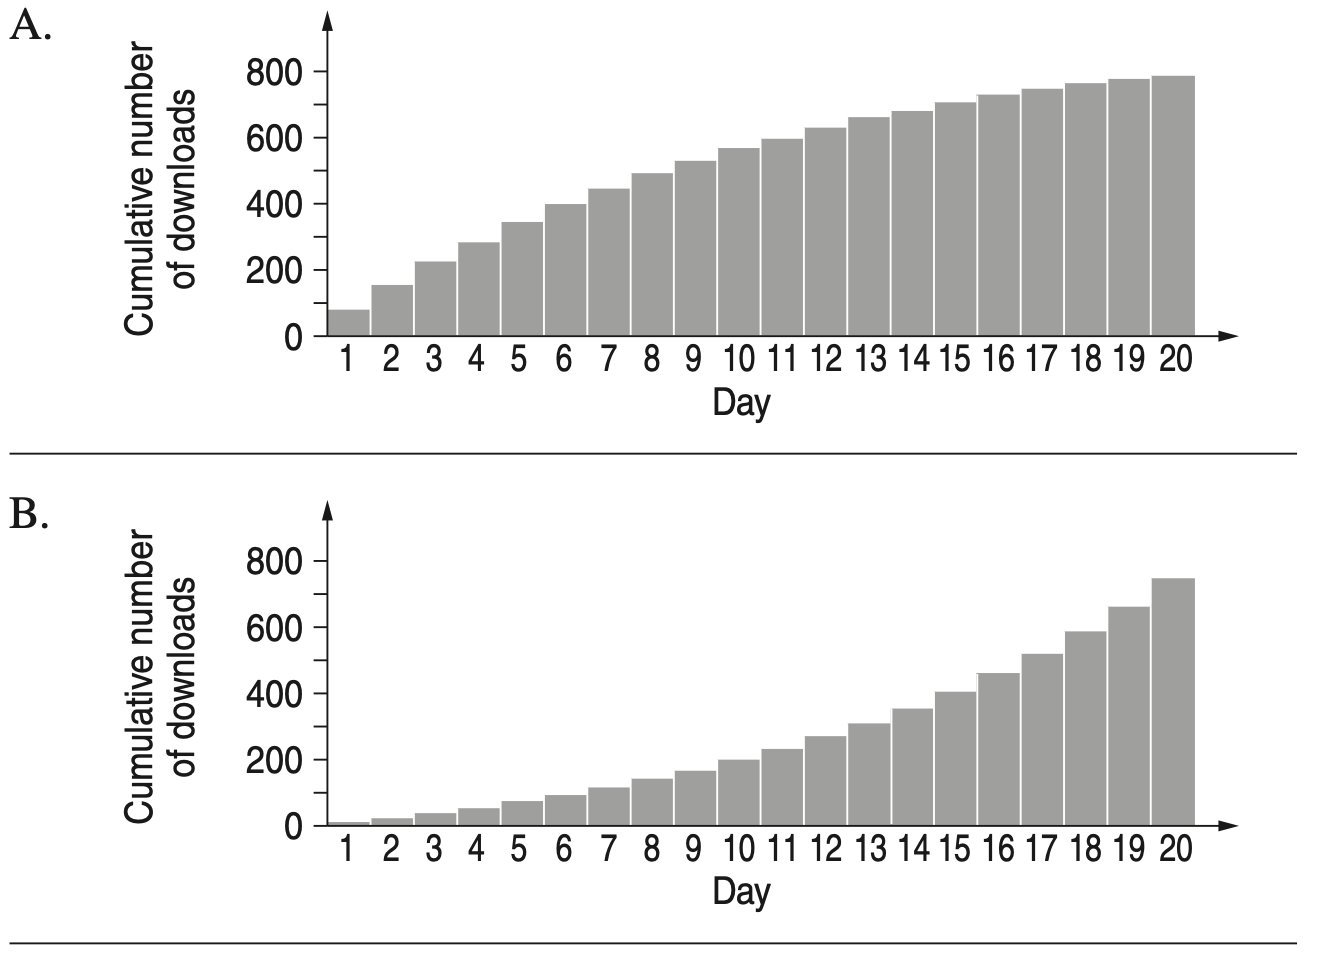
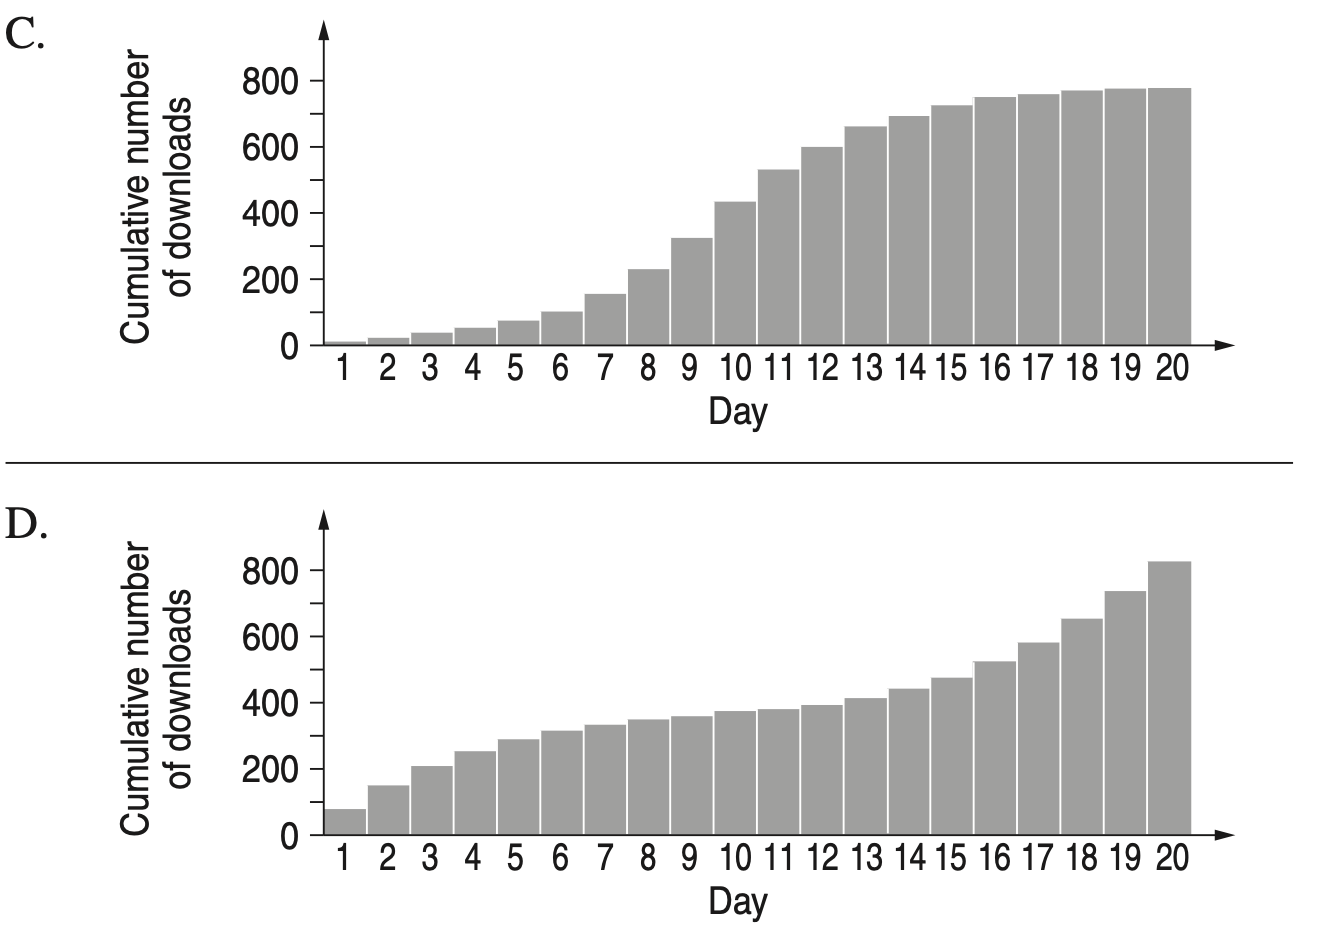
The number of downloads of a song on each of twenty consecutive days is shown in the following graph.

Which of the following graphs best shows the cumulative number of downloads up to and including each day?
Aussie Maths & Science Teachers: Save your time with SmarterEd
The number of downloads of a song on each of twenty consecutive days is shown in the following graph.
Which of the following graphs best shows the cumulative number of downloads up to and including each day?
The heights of 400 students were measured. The results are displayed in this cumulative frequency polygon.

Use the polygon to estimate the interquartile range. (2 marks)
--- 4 WORK AREA LINES (style=lined) ---
`text(See graph for values:)`

`IQR= Q_3-Q_1= 172-136=36\ text(cm)`
Data from 200 recent house sales are grouped into class intervals and a cumulative frequency histogram is drawn.

--- 1 WORK AREA LINES (style=lined) ---
\begin{array} {|c|c|}
\hline
\rule{0pt}{2.5ex} \text{Class Centre} \rule[-1ex]{0pt}{0pt} & \text{Frequency} \\ \text{(\$'000)} & \\
\hline
\rule{0pt}{2.5ex} \rule[-1ex]{0pt}{0pt} & \\
\hline
\rule{0pt}{2.5ex} \rule[-1ex]{0pt}{0pt} & \\
\hline
\rule{0pt}{2.5ex} \rule[-1ex]{0pt}{0pt} & \\
\hline
\rule{0pt}{2.5ex} \rule[-1ex]{0pt}{0pt} & \\
\hline
\end{array}
--- 2 WORK AREA LINES (style=lined) ---
| a. |
|
`text(From the graph, the estimated median)`
`text(house price = $392 500)`
b.
\begin{array} {|c|c|}
\hline
\rule{0pt}{2.5ex} \text{Class Centre} \rule[-1ex]{0pt}{0pt} & \text{Frequency} \\ \text{(\$’000)} & \\
\hline
\rule{0pt}{2.5ex} 375 \rule[-1ex]{0pt}{0pt} & 30\\
\hline
\rule{0pt}{2.5ex} 385 \rule[-1ex]{0pt}{0pt} & 50 \\
\hline
\rule{0pt}{2.5ex} 395 \rule[-1ex]{0pt}{0pt} & 70 \\
\hline
\rule{0pt}{2.5ex} 405 \rule[-1ex]{0pt}{0pt} & 50 \\
\hline
\end{array}
`text(Mean house price ($’000))`
`= (375xx30 + 385xx50 + 395xx70 + 405xx50)/200`
`=$392`
`:. text(Mean house price is)\ $392\ 000`
A set of examination results is displayed in a cumulative frequency histogram and polygon (ogive).

Sanath knows that his examination mark is in the 4th decile.
Which of the following could have been Sanath’s examination mark?

`text(4th decile occurs when cumulative frequency)`
`text(is between 15 and 20.)`
`:.\ text(Examination mark must be between 55 and 60.)`
`=> B`
The heights of the 60 members of a choir were recorded. These results were grouped and then displayed as a cumulative frequency histogram and polygon.
The shortest person in the choir is 140 cm and the tallest is 190 cm.

Draw an accurate box-and-whisker plot to represent the data. (3 marks)
--- 8 WORK AREA LINES (style=lined) ---
`text(Low) = 140`
`text(High) = 190`
`text(Median) = 150\ \ \ \ text{(# People = 30)}`
`Q_1 = 145\ \ \ \ text{(# People = 15)}`
`Q_3 = 170\ \ \ \ text{(# People = 45)}`
`text(Box and Whisker)`

A set of data is represented by the cumulative frequency histogram and ogive.

What is the best approximation for the interquartile range for this set of data?

`IQR= Q3-Q1= 80-45= 35`
`=> C`
The times taken for 160 music downloads were recorded, grouped into classes and then displayed using the cumulative frequency histogram shown.

On the diagram, draw the lines that are needed to find the median download time. (2 marks)
--- 0 WORK AREA LINES (style=lined) ---

A new shopping centre has opened near a primary school. A survey is conducted to determine the number of motor vehicles that pass the school each afternoon between 2.30 pm and 4.00 pm.
The results for 60 days have been recorded in the table and are displayed in the cumulative frequency histogram.

--- 1 WORK AREA LINES (style=lined) ---
What problem could arise from the change in the median number of motor vehicles passing the school before and after the opening of the new shopping centre?
Briefly recommend a solution to this problem. (2 marks)
--- 5 WORK AREA LINES (style=lined) ---
a. `15`
b.

c.

d. `text(Problems)`
`text(- increased traffic delays)`
`text(- increased danger to students leaving school)`
`text(Solutions)`
`text(- signpost alternative routes around school)`
`text(- decrease the speed limit in the area)`
a. `X= 25-10= 15`
| b. | |
c. `text(Median)\ ~~155`
| d. | `text(Problems)` |
| `text(- increased traffic delays)` | |
| `text(- increased danger to students leaving school)` | |
| `text(Solutions)` | |
| `text(- signpost alternative routes around school)` | |
| `text(- decrease the speed limit in the area)` |
A retailer has collected data on the number of televisions that he sold each week in 2012.
He grouped the data into classes and displayed the data using a cumulative frequency histogram and polygon (ogive).

--- 4 WORK AREA LINES (style=lined) ---
Is he correct? Give a reason for your answer. (1 mark)
--- 2 WORK AREA LINES (style=lined) ---
