SmarterEd

Aussie Maths & Science Teachers: Save your time with SmarterEd

  • Login
  • Get Help
  • About

Trigonometry, 2ADV T3 2025 HSC 15

A sound wave can be modelled using a function  \(P(t)=k\, \sin a t\), where \(P\) is air pressure in Pascals, \(t\) is time in milliseconds (ms) and \(k\) and \(a\) are constants.

  1. Write the equation for a sound wave \(P_1(t)\) that has an amplitude of 2 Pascals and a period of 5 ms.   (2 marks)

    --- 6 WORK AREA LINES (style=lined) ---

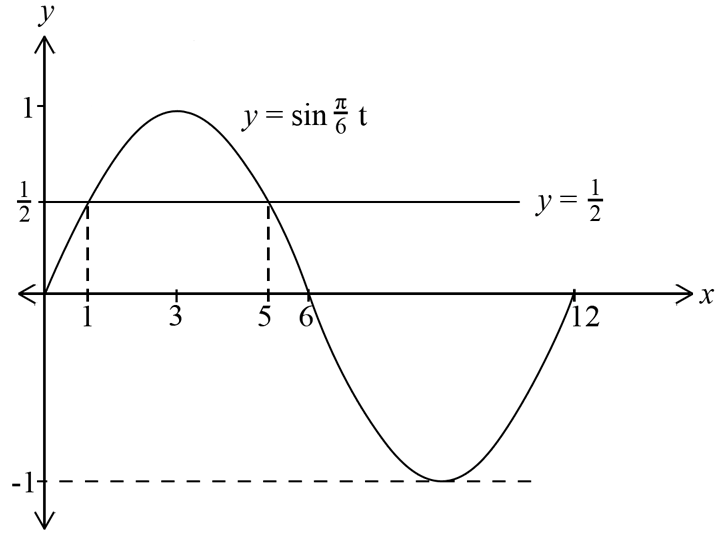
  2. The graph of \(P_1(t)\) from part (a) is shown.
  3. On the diagram, sketch the graph of  \(P_2(t)=4 \sin \left(\dfrac{\pi}{10} t\right)\)  for  \(0 \leq t \leq 10\).   (2 marks)
     

--- 5 WORK AREA LINES (style=lined) ---

  1. Hence, find the values of \(t\), where  \(0<t<10\),  for which functions \(P_1(t)\) and \(P_2(t)\) are BOTH decreasing.   (2 marks)

    --- 4 WORK AREA LINES (style=lined) ---

Show Answers Only

a.  \(P_1(t)=2\, \sin \left(\dfrac{2 \pi t}{5}\right)\)

b.   
       

c.  \(\text{Both decreasing for} \ \ 6.25<t<8.75\)

Show Worked Solution

a.    \(\text{Amplitude}=2 \Rightarrow k=2\)

\(\text{Period}=5\)

\(\dfrac{2 \pi}{a}\) \(=5\)
\(5a\) \(=2 \pi\)
\(a\) \(=\dfrac{2 \pi}{5}\)

 
\(\therefore P_1(t)=2\, \sin \left(\dfrac{2 \pi t}{5}\right)\)
 

b.   
     

\(P_2(t)=4\, \sin \left(\dfrac{\pi}{10} t\right)\)

\(\text{Amplitude}=4\)

\(\text{Period}=\dfrac{2 \pi}{\frac{\pi}{10}}=20\)
 

c.    \(\text {By inspection of graph:}\)

\(P_2(t) \ \text {is decreasing for} \ \ 5<t \leq10\)

\(P_1(t) \text { is decreasing for} \ \ 1.25<t<3.75 \ \ \text{and}\ \ 6.25<t<8.75\)

\(\therefore \ \text{Both decreasing for} \ \ 6.25<t<8.75\)

Filed Under: Modelling with Functions, Trigonometric Functions Tagged With: Band 3, Band 4, smc-1188-30-Other Applications, smc-7125-10-Trig Applications, smc-977-10-sin

Trigonometry, 2ADV T3 2024 HSC 28

Anna is sitting in a carriage of a Ferris wheel which is revolving. The height, \(A(t)\), in metres above the ground of the top of her carriage is given by

\(A(t)=c-k\,\cos\Big( \dfrac{\pi t}{24}\Big) \),

where \(t\) is the time in seconds after Anna's carriage first reaches the bottom of its revolution and \(c\) and \(k\) are constants.
 

The top of each carriage reaches a greatest height of 39 metres and a smallest height of 3 metres.

  1. Find the value of \(c\) and \(k\).   (2 marks)

    --- 4 WORK AREA LINES (style=lined) ---

  2. How many seconds does it take for one complete revolution of the Ferris wheel?   (1 mark)

    --- 2 WORK AREA LINES (style=lined) ---

  3. Billie is in another carriage. The height, \(B(t)\), in metres above the ground of the top of her carriage is given by

\(B(t)=c-k\,\cos\Big( \dfrac{\pi}{24}(t-6)\Big) \),

  1. where \(c\) and \(k\) are as found in part (a).
  2. During each revolution, there are two occasions when Anna's and Billie's carriages are at the same heights. At what two heights does this occur? Give your answer correct to 2 decimal places.    (4 marks)

    --- 12 WORK AREA LINES (style=lined) ---

Show Answers Only

a.   \(c=\ \text{centre of motion}\ = \dfrac{39+3}{2} = 21\)

\(k=\ \text{amplitude}\ = \dfrac{39-3}{2}=18\)

b.  \(T= 48\ \text{seconds}\)

c.  \(h_1=4.37\ \text{m,}\ h_2=37.63\ \text{m}\)

Show Worked Solution

a.   \(c=\ \text{centre of motion}\ = \dfrac{39+3}{2} = 21\)

\(k=\ \text{amplitude}\ = \dfrac{39-3}{2}=18\)
 

b.  \(A(t)=21-18\,\cos\Big( \dfrac{\pi t}{24}\Big)\ \Rightarrow\ \ n=\dfrac{\pi}{24} \)

\(T=\dfrac{2\pi}{n} = 2\pi \times \dfrac{24}{\pi} = 48\ \text{seconds}\)
 

c.   \(\text{Strategy 1}\)

\(\text{Billie’s carriage is 6 seconds behind Anna’s.}\)

\(\text{When}\ t=0,\ \text{Anna’s carriage is at the lowest point}\ = 21-18=3\)

\(\text{When}\ t=3,\ \text{by symmetry, both carriages are at the same height:}\)

   \(h_1=21-18\cos(\dfrac{\pi}{8}) = 4.370… = 4.37\ \text{m (2 d.p.)}\)
 

\(\text{When}\ t=24,\ \text{Anna’s carriage is at the highest point}\ = 21+18=39\)

\(\text{When}\ t=27,\ \text{by symmetry, both carriages are at the same height:}\)

   \(h_2=21-18\cos(\dfrac{9\pi}{8}) = 37.629… = 37.63\ \text{m (2 d.p.)}\)
 

\(\text{Strategy 2}\)

\(\text{Angle between the 2 carriages}\ = \dfrac{\pi \times 6}{24} = \dfrac{\pi}{4} \)

\(\text{By inspection:}\)
 

\(\text{Heights are the same:}\)

\(h_1=21-18\cos(\dfrac{\pi}{8}) = 4.370… = 4.37\ \text{m (2 d.p.)}\)

\(h_2=21-18\cos(\dfrac{7\pi}{8}) = 37.629… = 37.63\ \text{m (2 d.p.)}\)

♦♦ Mean mark (c) 38%.

Filed Under: Modelling with Functions, Trig Applications Tagged With: Band 4, Band 5, smc-1188-30-Other Applications, smc-7125-10-Trig Applications

Trigonometry, 2ADV T3 2022 HSC 23

The depth of water in a bay rises and falls with the tide. On a particular day the depth of the water, `d` metres, can be modelled by the equation

`d=1.3-0.6 cos((4pi)/(25)t)`,

where `t` is the time in hours since low tide.

  1. Find the depth of water at low tide and at high tide.  (2 marks)

    --- 3 WORK AREA LINES (style=lined) ---

  2. What is the time interval, in hours, between two successive low tides?  (1 mark)

    --- 3 WORK AREA LINES (style=lined) ---

  3. For how long between successive low tides will the depth of water be at least 1 metre?  (3 marks)

    --- 6 WORK AREA LINES (style=lined) ---

Show Answers Only
  1. `text{Low: 0.7 m,  High: 1.9 m}`
  2. `25/2\ text{hours}`
  3. `25/3\ text{hours}`
Show Worked Solution

a.   `text{S}text{ince}\ \ –1<=cos((4pi)/(25)t)<=1:`

`text{Low Tide}\ =1.3-0.6(1)=0.7\ text{m}`

`text{High Tide}\ =1.3-0.6(-1)=1.9\ text{m}`
 

b.   `text{Time between two low tides = Period of equation}\ (n)`

`(2pi)/n` `=(4pi)/25`  
`n/(2pi)` `=25/(4pi)`  
`n` `=25/2\ text{hours}`  


♦ Mean mark part (b) 47%.

c.   `text{Find}\ \ t\ \ text{when}\ \ d=1:`

`1.3-0.6 cos((4pi)/(25)t)` `=1`  
`-0.6 cos((4pi)/(25)t)` `=-0.3`  
`cos((4pi)/(25)t)` `=1/2`  


`(4pi)/(25)t` `=pi/3,\ \ (5pi)/3`  
`t` `=25/12,\ \ 125/12`  

 
`:.\ text{Time between low tides where water depth}\ >= 1\ text{m}`

`=125/12-25/12`

`=100/12`

`=25/3\ text{hours}`


♦ Mean mark part (c) 46%.

Filed Under: Modelling with Functions, Trig Applications Tagged With: Band 4, Band 5, smc-1188-20-Tides, smc-7125-10-Trig Applications, smc-7125-40-Tide Models

Trigonometry, 2ADV T3 2011 SPEC1 8

Find the coordinates of the points of intersection of the graph of the relation

`y = text(cosec)^2 ((pi x)/6)`  with the line  `y = 4/3`, for  `0 < x < 12.`  (3 marks)

--- 6 WORK AREA LINES (style=lined) ---

Show Answers Only

`(2, 4/3),(4, 4/3),(8, 4/3), (10, 4/3)`

Show Worked Solution

`text(Intersection occurs when:)`

`text(cosec)^2((pix)/6)` `=4/3`
`text(cosec)((pix)/6)` `= ±2/sqrt3`
`sin((pix)/6)` `= ±sqrt3/2`

 
`text(Given:)\ \ 0 < x < 12 \ \ =>\ \ 0 < (pix)/6 < 2pi`
 

`(pix)/6` `= pi/3, pi – pi/3, pi + pi/3, 2pi – pi/3`
  `= pi/3, (2pi)/3, (4pi)/3,(5pi)/3`
`x` `= 2, 4, 8, 10`

  
`=> y = 4/3\ text(for each)`

`:.\ text(Intersection at:)\ \ (2, 4/3),(4, 4/3),(8, 4/3), (10, 4/3)`

Filed Under: Modelling with Functions, Trig Applications Tagged With: Band 5, smc-1188-30-Other Applications, smc-7125-10-Trig Applications

Trigonometry, 2ADV T3 2020 HSC 31

The population of mice on an isolated island can be modelled by the function.

`m(t) = a sin (pi/26 t) + b`,

where  `t`  is the time in weeks and  `0 <= t <= 52`. The population of mice reaches a maximum of 35 000 when  `t=13`  and a minimum of 5000 when  `t = 39`. The graph of  `m(t)`  is shown.
 

  1. What are the values of `a` and `b`?  (2 marks)

    --- 3 WORK AREA LINES (style=lined) ---

  2. On the same island, the population of cats can be modelled by the function
     
    `\ \ \ \ \ c(t) = −80cos(pi/26 (t - 10)) + 120`
     
    Consider the graph of  `m(t)`  and the graph of  `c(t)`.


    Find the values of  `t, \ 0 <= t <= 52`, for which both populations are increasing.  (3 marks)

    --- 7 WORK AREA LINES (style=lined) ---

  3. Find the rate of change of the mice population when the cat population reaches a maximum.  (2 marks)

    --- 5 WORK AREA LINES (style=lined) ---

Show Answers Only
  1. `a = 15\ 000, b = 20\ 000`
  2. `text(Both populations are increasing when)\ 10 < t < 13`
  3. `\text(– 643 mice per week)`
Show Worked Solution
a.    `b` `= (35\ 000 + 5000)/2`
    `= 20\ 000`


`a` `=\ text(amplitude of sin graph)`
  `= 35\ 000 – 20\ 000`
  `= 15\ 000`


b.   `text(By inspection of the)\ \ m(t)\ \ text(graph)`

♦♦ Mean mark part (b) 30%.

`m^{′}(t) > 0\ \ text(when)\ \ 0 <= t < 13\ \ text(and)\ \ 39 < t <= 52`

`text(Sketch)\ \ c(t):`

`text(Minimum)\ \ (cos0)\ \ text(when)\ \ t = 10`

`text(Maximum)\ \ (cospi)\ \ text(when)\ \ t = 36`

`:. c^{′}(t) > 0\ \ text(when)\ \ 10 < t < 36`

`:. text(Both populations are increasing when)\ \ 10 < t < 13`


c.   `c(t)\ text(maximum when)\ \ t = 36`

♦♦♦ Mean mark part (c) 27%.
`m(t)` `= 15\ 000 sin(pi/26 t) + 20\ 000`
`m^{′}(t)` `= (15\ 000pi)/26 cos(pi/26 t)`
`m^{′}(36)` `= (15\ 000pi)/26 · cos((36pi)/26)`
  `= -642.7`

 
`:.\ text(Mice population is decreasing at 643 mice per week.)`

Filed Under: Modelling with Functions, Rates of Change, Rates of Change, Trig Applications Tagged With: Band 4, Band 5, Band 6, smc-1091-25-Other Themes, smc-1091-40-Trig Function, smc-1188-10-Population, smc-7125-10-Trig Applications, smc-7125-30-Population Models, smc-7135-40-Other Themes

Trigonometry, 2ADV T3 SM-Bank 16

Sammy visits a giant Ferris wheel. Sammy enters a capsule on the Ferris wheel from a platform above the ground. The Ferris wheel is rotating anticlockwise. The capsule is attached to the Ferris wheel at point `P`. The height of `P` above the ground, `h`, is modelled by  `h(t) = 65 - 55cos((pit)/15)`, where `t` is the time in minutes after Sammy enters the capsule and `h` is measured in metres.

Sammy exits the capsule after one complete rotation of the Ferris wheel.


  1. State the minimum and maximum heights of `P` above the ground.  (1 mark)

    --- 2 WORK AREA LINES (style=lined) ---

  2. For how much time is Sammy in the capsule?  (1 mark)

    --- 1 WORK AREA LINES (style=lined) ---

  3. Find the rate of change of `h` with respect to `t` and, hence, state the value of `t` at which the rate of change of `h` is at its maximum.  (2 marks)

    --- 4 WORK AREA LINES (style=lined) ---

Show Answers Only

a.    `h_text(min) = 10\ text(m), h_text(max) = 120\ text(m)`

b.    `30\ text(min)`

c.    `t = 7.5`

Show Worked Solution
a.     `h_text(min)` `= 65 – 55` `h_text(max)` `= 65 + 55`
    `= 10\ text(m)`   `= 120\ text(m)`


b.    `text(Period) = (2pi)/(pi/15) = 30\ text(min)`


c.      `h′(t)` `=65 – 55cos((pit)/15)`
  `h′(t)` `=pi/15 xx 55sin(pi/15 t)`
    `= (11pi)/3\ sin(pi/15 t)`
     

`text(S)text(ince)\ \ sin(pi/15 t)_text(max) = sin (pi/2),`

 
`:. h′(t)_text(max)\ \ text(occurs when)`

`(pi t)/15` `=pi/2`  
`:. t` `=pi/2 xx 15/pi`  
  `=15/2\ text(minutes)\ \ (0<=t<=30)`  

Filed Under: Maxima and Minima, Modelling with Functions, Optimisation, Trig Applications Tagged With: Band 4, Band 5, smc-1188-30-Other Applications, smc-7125-10-Trig Applications, smc-7134-60-Other Themes, smc-970-60-Other Themes

Trigonometry, 2ADV T3 SM-Bank 15

The graphs of  `y = cos (x) and y = a sin (x)`,  where `a` is a real constant, have a point of intersection at  `x = pi/3.`

  1. Find the value of `a`.  (2 marks)

    --- 4 WORK AREA LINES (style=lined) ---

  2. Find the  `x`-coordinate of the other point of intersection of the two graphs, given  `0<=x<= 2 pi`  (1 mark)

    --- 2 WORK AREA LINES (style=lined) ---

Show Answers Only

a.    `1/sqrt 3`

b.    `(4 pi)/3`

Show Worked Solution

a.    `text(Intersection occurs when)\ \ x=pi/3,`

`a sin(pi/3)` `= cos (pi/3)`
`tan(pi/3)` `= 1/a`
`sqrt 3` `=1/a`
`:. a` `=1/sqrt3`


b.     `tan (x)` `= sqrt 3`
  `x` `= pi/3, (4 pi)/3, 2pi+ pi/3, …`
  `:. x` `= (4 pi)/3\ \ \ (0<= x<= 2 pi)`

Filed Under: Modelling with Functions, Trig Applications Tagged With: Band 3, Band 5, smc-1188-30-Other Applications, smc-7125-10-Trig Applications

Trigonometry, 2ADV T3 SM-Bank 13

On any given day, the depth of water in a river is modelled by the function

`h(t) = 14 + 8sin((pit)/12),\ \ 0 <= t <= 24`

where `h` is the depth of water, in metres, and  `t`  is the time, in hours, after 6 am. 

  1. Find the minimum depth of the water in the river.  (1 mark)

    --- 1 WORK AREA LINES (style=lined) ---

  2. Find the values of  `t`  for which  `h(t) = 10`.  (2 marks)

    --- 4 WORK AREA LINES (style=lined) ---

Show Answers Only

a.    `6\ text(m)`

b.    `14quadtext(or)quad22`

Show Worked Solution

a.    `h_(text(min))\ text(occurs when)\ \ sin((pit)/12)=-1`

MARKER’S COMMENT: Students who used calculus to find the minimum were less successful.
`:. h_(text(min))` `= 14 – 8`
  `= 6\ text(m)`


b.      `14 + 8sin(pi/12t)` `= 10`
  `sin(pi/12t)` `= – 1/2`


`text(Solve in general:)`

`pi/12t` `=(7pi)/6 + 2pi n\ \ \ \ text(or)\ \ \ `  `pi/12t` `= (11t)/6 + 2pi n,`
`t` `= 14 + 24n` `t` `=22 + 24n`


`text(Substitute integer values for)\ n,`

`:. t = 14quadtext(or)quad22,\ \ \ (0<=t<=24)`

Filed Under: Modelling with Functions, Trig Applications Tagged With: Band 4, smc-1188-20-Tides, smc-7125-10-Trig Applications, smc-7125-40-Tide Models

Trigonometry, 2ADV T3 SM-Bank 10

The population of wombats in a particular location varies according to the rule  `n(t) = 1200 + 400 cos ((pi t)/3)`, where `n` is the number of wombats and `t` is the number of months after 1 March 2018.

  1. Find the period and amplitude of the function `n`.  (2 marks)

    --- 4 WORK AREA LINES (style=lined) ---

  2. Find the maximum and minimum populations of wombats in this location.  (2 marks)

    --- 3 WORK AREA LINES (style=lined) ---

  3. Find  `n(10)`.  (1 mark)

    --- 2 WORK AREA LINES (style=lined) ---

  4. Over the 12 months from 1 March 2018, find the fraction of time when the population of wombats in this location was less than  `n(10)`.  (2 marks)

    --- 4 WORK AREA LINES (style=lined) ---

Show Answers Only

a.    `text(Period) = text(6 months);\ text(Amplitude) = 400`

b.    `text(Max) = 1600;\ text(Min) = 800`

c.    `1000`

d.    `1/3`

Show Worked Solution

a.    `text(Period) = (2pi)/n = (2pi)/(pi/3) = 6\ text(months)`

`text(A)text(mplitude) = 400`
 

b.    `text(Max:)\ 1200 + 400 = 1600\ text(wombats)`

`text(Min:)\ 1200 – 400 = 800\ text(wombats)`
 

c.      `n(10)` `=1200 + 400 cos ((10 pi)/3)`
    `=1200 + 400 cos ((2 pi)/3)`
    `=1200-400 xx 1/2`
    `= 1000\ text(wombats)`


d.    `text(Find)\ \ t\ \ text(when)\ \ n(t)=1000`

`1000` `=1200 + 400 cos((pit)/3)`  
`cos((pit)/3)` `=- 1/2`  
`(pit)/3` `=(2pi)/3, (4pi)/3, (8pi)/3, (10pi)/3, … `  
`t` `=2,4,8,10`  

 
`text(S)text(ince)\ \ n(0)=1600,`

`=> n(t)\ \ text(drops below 1000 between)\ \ t=2\ \ text(and)\ \ t=4,`

`text(and between)\ \ t=8\ \ text(and)\ \ t=10.`
 

`:.\ text(Fraction)` `= (2 + 2)/12`
  `= 1/3\ \ text(year)`

Filed Under: Modelling with Functions, Trig Applications Tagged With: Band 3, Band 4, Band 5, smc-1188-10-Population, smc-7125-10-Trig Applications, smc-7125-30-Population Models

Trigonometry, 2ADV T3 SM-Bank 5 MC

The UV index, `y`, for a summer day in Newcastle East is illustrated in the graph below, where  `t`  is the number of hours after 6 am.


The graph is most likely to be the graph of

  1. `y = 5 + 5 cos ((pi t)/7)`
  2. `y = 5 - 5 cos ((pi t)/7)`
  3. `y = 5 + 5 cos ((pi t)/14)`
  4. `y = 5 - 5 cos ((pi t)/14)`
Show Answers Only

`B`

Show Worked Solution

`text{Centre line (median):}  \ y = 5`

`text(Amplitude) = 5`

`text(Period:)\ \ 14` `= (2 pi)/n`
`n` `= pi/7`


`:.\ text(Graph:)\ \ y = 5 – 5 cos ((pi t)/7)`

`=>   B`

Filed Under: Modelling with Functions, Trig Applications Tagged With: Band 4, smc-1188-30-Other Applications, smc-7125-10-Trig Applications

Trigonometry, 2ADV T3 2018 HSC 15a

The length of daylight, `L(t)`, is defined as the number of hours from sunrise to sunset, and can be modelled by the equation

`L(t) = 12 + 2 cos ((2 pi t)/366)`,

where `t` is the number of days after 21 December 2015, for  `0 ≤ t ≤ 366`.

  1. Find the length of daylight on 21 December 2015.   (1 mark)

    --- 1 WORK AREA LINES (style=lined) ---

  2. What is the shortest length of daylight?  (1 mark)

    --- 1 WORK AREA LINES (style=lined) ---

  3. What are the two values of  `t`  for which the length of daylight is 11?  (2 marks)

    --- 4 WORK AREA LINES (style=lined) ---

Show Answers Only
  1. `14\ text(hours)`
  2. `10\ text(hours)`
  3. `t = 122 or 244`
Show Worked Solution

i.   `L(t) = 12 + 2 cos ((2 pi t)/366)`

`text(On 21 Dec 2015) => t = 0`

`:. L(0)` `= 12 + 2 cos 0`
  `= 14\ text(hours)`


ii.   `text(Shortest length of daylight occurs when)`

♦ Mean mark 43%.

`cos ((2 pi t)/366) = -1`
 

`:.\ text(Shortest length)` `= 12 + 2 (-1)`
  `= 10\ text(hours)`


iii.   `text(Find)\ \ t\ \ text(such that)\ \ L(t) = 11:`

`11 = 12 + 2 cos ((2 pi t)/366)`

`cos ((2 pi t)/366) = -1/2`
 

`(2 pi t)/366` `= (2 pi)/3` `qquad\ \ text(or)`     `(2 pi t)/366` `= (4 pi)/3`
`t` `= 366/3`   `t` `= (366 xx 2)/3`
  `= 122`     `= 244`

 
`:. t = 122 or 244`

Filed Under: Exact Trig Ratios and Other Identities, Modelling with Functions, Trig Applications Tagged With: Band 3, Band 4, Band 5, smc-1188-30-Other Applications, smc-7125-10-Trig Applications

Trigonometry, 2ADV T3 2009 HSC 7b

Between 5 am and 5 pm on 3 March 2009, the height, `h`, of the tide in a harbour was given by

`h = 1 + 0.7 sin(pi/6 t)\ \ \ text(for)\ \ 0 <= t <= 12`

where  `h`  is in metres and  `t`  is in hours, with  `t = 0`  at 5 am. 

  1. What is the period of the function  `h`?    (1 mark)

    --- 2 WORK AREA LINES (style=lined) ---

  2. What was the value of  `h`  at low tide, and at what time did low tide occur?     (2 marks)

    --- 4 WORK AREA LINES (style=lined) ---

  3. A ship is able to enter the harbour only if the height of the tide is at least 1.35 m.
  4. Find all times between 5 am and 5 pm on 3 March 2009 during which the ship was able to enter the harbour.    (3 marks)

    --- 6 WORK AREA LINES (style=lined) ---

Show Answers Only

a.    `12\ text(hours)`

b.    `text(2pm)\ \ text{(5am + 9 hours)}`

c.    `text(6am to 10am)`

Show Worked Solution

a.    `h = 1 + 0.7 sin (pi/6 t)\ \ text(for)\ 0 <= t <= 12`

`T` `= (2pi)/n\ \ text(where)\ n = pi/6`
  `= 2 pi xx 6/pi`
  `= 12\ text(hours)`


`:.\ text(The period of)\ h\ text(is 12 hours.)`


b.    `text(Find)\ h\ text(at low tide)`

IMPORTANT: Using `sin x=–1` for a minimum here is very effective and time efficient. This property of trig functions is often very useful in harder questions.

`=> h\ text(will be a minimum when)`

`sin(pi/6 t) = -1`

`:.\ h_text(min)` `= 1 + 0.7(-1)`
  `= 0.3\ text(metres)`


`text(S)text(ince)\ \ sinx = -1\ \ text(when)\ \ x = (3pi)/2`

`pi/6 t` `= (3pi)/2`
`t` `= (3pi)/2 xx 6/pi`
  `= 9\ text(hours)`

 
`:.\ text{Low tide occurs at 2pm (5 am + 9 hours)}`


c.   
`text(Find)\ \ t\ \ text(when)\ \ h >= 1.35`

`1 + 0.7 sin (pi/6 t)` `>= 1.35`
`0.7 sin (pi/6 t)` `>= 0.35`
`sin (pi/6 t)` `>= 1/2`
`sin (pi/6 t)` `= 1/2\ text(when)`
`pi/6 t` `= pi/6,\ (5pi)/6,\ (13pi)/6,\ text(etc …)`
   
`t` `= 1,\ 5\ \ \ \ \ \ (0 <= t <= 12)`


Trig Calculus, 2UA 2009 HSC 7b Answer

`text(From the graph,)`

`sin(pi/6 t) >= 1/2\ \ \ text(when)\ \ 1 <= t <= 5`

 
`:.\ text(Ship can enter the harbour between 6 am and 10 am.)`

Filed Under: Modelling with Functions, Trig Applications, Trig graphs Tagged With: Band 4, Band 5, Band 6, smc-1188-20-Tides, smc-7125-10-Trig Applications, smc-7125-40-Tide Models

Trigonometry, 2ADV T3 2013 HSC 13a

The population of a herd of wild horses is given by

`P(t) = 400 + 50 cos (pi/6 t)`

where  `t`  is time in months. 

  1. Find all times during the first 12 months when the population equals 375 horses.    (2 marks)

    --- 5 WORK AREA LINES (style=lined) ---

  2. Sketch the graph of  `P(t)`  for  `0 <= t <= 12`.    (2 marks)

    --- 8 WORK AREA LINES (style=lined) ---

Show Answers Only

a.    `t=4\ text(months and 8 months)`

b.    `text(See Worked Solutions.)`

Show Worked Solution

a.    `P(t) = 400 + 50 cos (pi/6 t)`

`text(Need to find)\ t\ text(when)\ P(t) = 375`

`375` `= 400 + 50 cos (pi/6 t)`
`50 cos (pi/6 t)` `=-25`
`cos (pi/6 t)` `= – 1/2`
   
`text(S)text(ince)\ \ cos(pi/3)=1/2, text(and cos is)`
`text(negative in)\ 2^text(nd) // 3^text(rd)\ text(quadrants:)`
`=>pi/6 t` `= (pi\ – pi/3),\ (pi + pi/3),\ (3pi\ – pi/3)`
  `= (2pi)/3,\ (4pi)/3,\ (8pi)/3,\ …`
`:.t` `= 4,\ 8,\ 16,\ …`

 
`:.\ text(In the 1st 12 months,)\ P(t) = 375\ text(when)`

`t=4\ text(months and 8 months.)`


♦ Mean mark 39%
b.     2UA 2013 13a ans

Filed Under: Exact Trig Ratios and Other Identities, Modelling with Functions, Trig Applications, Trig graphs Tagged With: Band 4, Band 5, smc-1188-10-Population, smc-7125-10-Trig Applications, smc-7125-30-Population Models

Copyright © 2014–2026 SmarterEd.com.au · Log in