In a particular electrical circuit, the voltage \(V\) (volts) across a capacitor is given by \(V(t)=6.5\left(1-e^{-k t}\right)\), where \(k\) is a positive constant and \(t\) is the number of seconds after the circuit is switched on. --- 0 WORK AREA LINES (style=blank) --- --- 6 WORK AREA LINES (style=lined) --- --- 4 WORK AREA LINES (style=lined) --- a. b. \(k=0.511\) c. \(1.195\ \text{V/s}\) b. \(V=6.5(1-e^{-kt})\) \(\text{When}\ \ t=1, V=2.6:\) \(\dfrac{dV}{dt}=6.5ke^{-kt}\) \(\text{Find}\ \dfrac{dV}{dt}\ \text{when}\ \ t=2:\)

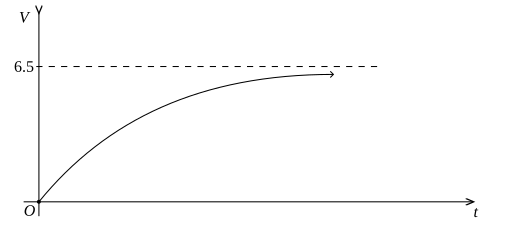
\(2.6\)
\(=6.5(1-e^{-k})\)
\(1-e^{-k}\)
\(=0.4\)
\(e^{-k}\)
\(=0.6\)
\(-k\)
\(=\ln(0.6)\)
\(k\)
\(=0.5108…\)
\(=0.511\ \text{(3 d.p.)}\)
c. \(V=6.5-6.5e^{-kt}\)
\(\dfrac{dV}{dt}\)
\(=6.5 \times 0.511 \times e^{-2 \times 0.511}\)
\(=1.1953…\)
\(=1.195\ \text{V/s (3 d.p.)}\)
Trigonometry, 2ADV T3 2020 HSC 31
The population of mice on an isolated island can be modelled by the function.
`m(t) = a sin (pi/26 t) + b`,
where `t` is the time in weeks and `0 <= t <= 52`. The population of mice reaches a maximum of 35 000 when `t=13` and a minimum of 5000 when `t = 39`. The graph of `m(t)` is shown.
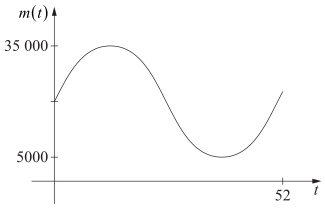
- What are the values of `a` and `b`? (2 marks)
--- 3 WORK AREA LINES (style=lined) ---
- On the same island, the population of cats can be modelled by the function
`\ \ \ \ \ c(t) = −80cos(pi/26 (t-10)) + 120`
Consider the graph of `m(t)` and the graph of `c(t)`.
Find the values of `t, \ 0 <= t <= 52`, for which both populations are increasing. (3 marks)
--- 7 WORK AREA LINES (style=lined) ---
- Find the rate of change of the mice population when the cat population reaches a maximum. (2 marks)
--- 5 WORK AREA LINES (style=lined) ---
Show Worked Solution
a. `b=(35\ 000 + 5000)/2= 20\ 000`
| `a` | `=\ text(amplitude of sin graph)` |
| `= 35\ 000-20\ 000` | |
| `= 15\ 000` |
b. `text(By inspection of the)\ \ m(t)\ \ text(graph)`
♦♦ Mean mark (b) 30%.
`m^{′}(t) > 0\ \ text(when)\ \ 0 <= t < 13\ \ text(and)\ \ 39 < t <= 52`
`text(Sketch)\ \ c(t):`
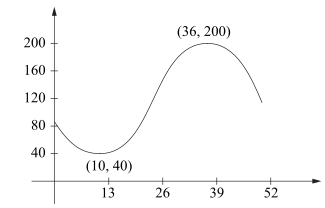
`text(Minimum)\ \ (cos0)\ \ text(when)\ \ t = 10`
`text(Maximum)\ \ (cospi)\ \ text(when)\ \ t = 36`
`:. c^{′}(t) > 0\ \ text(when)\ \ 10 < t < 36`
`:. text(Both populations are increasing when)\ \ 10 < t < 13`
c. `c(t)\ text(maximum when)\ \ t = 36`
♦♦♦ Mean mark (c) 27%.
| `m(t)` | `= 15\ 000 sin(pi/26 t) + 20\ 000` |
| `m^{′}(t)` | `= (15\ 000pi)/26 cos(pi/26 t)` |
| `m^{′}(36)` | `= (15\ 000pi)/26 · cos((36pi)/26)` |
| `= -642.7` |
`:.\ text(Mice population is decreasing at 643 mice per week.)`
Calculus, 2ADV C3 2016 HSC 16b
Some yabbies are introduced into a small dam. The size of the population, `y`, of yabbies can be modelled by the function
`y = 200/(1 + 19e^(-0.5t)),`
where `t` is the time in months after the yabbies are introduced into the dam.
- Show that the rate of growth of the size of the population is
- `qquad qquad (1900 e^(-0.5t))/(1 + 19 e^(-0.5t))^2`. (2 marks)
--- 4 WORK AREA LINES (style=lined) ---
- Find the range of the function `y`, justifying your answer. (2 marks)
--- 4 WORK AREA LINES (style=lined) ---
- Show that the rate of growth of the size of the population can be written as
- `qquad qquad y/400 (200-y)`. (1 mark)
--- 4 WORK AREA LINES (style=lined) ---
- Hence, find the size of the population when it is growing at its fastest rate. (2 marks)
--- 4 WORK AREA LINES (style=lined) ---
Show Worked Solution
| a. | `y` | `= 200/(1 + 19 e^(-0.5t))` |
| `(dy)/(dt)` | `= 200/(1 + 19 e^(-0.5t))^2 xx d/(dt) (1 + 19 e^(-0.5t))` | |
| `= (-200)/(1 + 19 e^(-0.5t))^2 xx -0.5 xx 19 e^(-0.5t)` | ||
| `= (1900 e^(-0.5t))/(1 + 19 e^(-0.5t))^2\ \ text(… as required)` |
b. `text(When)\ \ t = 0,`
♦♦♦ Mean mark (b) 21%.
`y = 200/(1 + 19) = 10`
`text(As)\ \ t -> oo,\ \ (1 + 19^(-0.5t)) -> 1`
`:. y -> 200`
`:.\ text(Range)\ \ \ 10 <= y < 200`
c. `(dy)/(dt) = (1900 e^(-0.5t))/(1 + 19 e^(-0.5t))^2`
♦♦♦ Mean mark (c) 18%.
`text(S) text(ince)\ \ y = 200/(1 + 19 e^(-0.5t))`
`-> (1 + 19 e^(-0.5t)) = 200/y`
`-> 19 e^(-0.5t) = 200/y-1 = (200-y)/y`
`text(Substituting into)\ \ (dy)/(dt):`
| `(dy)/(dt)` | `= (100 ((200-y)/y))/(200/y)^2` |
| `= 100 ((200-y)/y) xx y^2/200^2` | |
| `= y/400 (200-y)\ \ text(… as required)` |
d. `(dy)/(dt) = -y^2/400 + y/2`
♦♦♦ Mean mark (d) 14%.
`text(Sketching the parabola:)`
| `(-y^2)/400 + y/2` | `= 0` |
| `-y^2 + 200y` | `= 0` |
| `y (200-y)` | `= 0` |
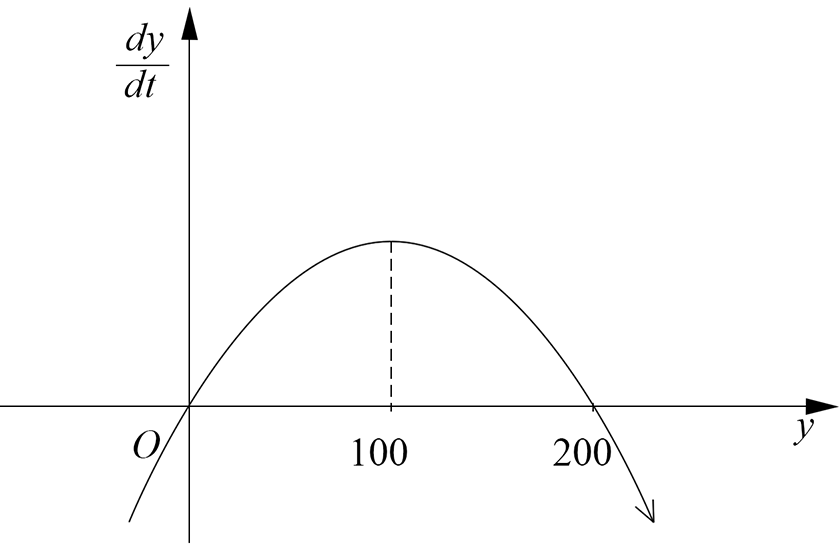
`:.\ text(Maximum)\ \ (dy)/(dt)\ \ text(occurs when)\ \ y = 100.`