The graph of the parabola \(y=a(x+1)(x+7)\) for some value of \(a\) is shown.
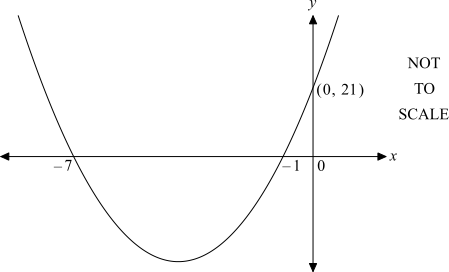
By first finding the value of \(a\), find the coordinates of the vertex. (3 marks)
--- 10 WORK AREA LINES (style=lined) ---
Aussie Maths & Science Teachers: Save your time with SmarterEd
The graph of the parabola \(y=a(x+1)(x+7)\) for some value of \(a\) is shown.
By first finding the value of \(a\), find the coordinates of the vertex. (3 marks)
--- 10 WORK AREA LINES (style=lined) ---
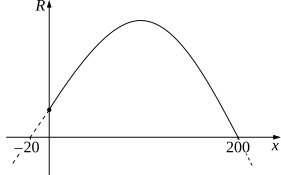
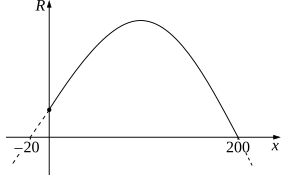
A toy store releases a limited edition LEGO set for $20 each. At this price, 3000 LEGO sets are sold each week and the revenue is `3000 xx 20=$60\ 000`.
The toy store considers increasing the price. For every dollar price increase, 15 fewer LEGO sets will be sold.
If the toy store charges `(20+x)` dollars for each LEGO set, a quadratic model for the revenue raised, `R`, from selling them is
`R=-15x^2+2700x+60\ 000`
What price should be charged per LEGO set to maximise the revenue? (2 marks)
--- 4 WORK AREA LINES (style=lined) ---
How many LEGO sets are sold when the revenue is maximised? (2 marks)
--- 4 WORK AREA LINES (style=lined) ---
--- 2 WORK AREA LINES (style=lined) ---
Sage brings 60 cartons of unpasteurised milk to the market each week. Each carton currently sells for $4 and at this price, all 60 cartons are sold each weekend.
Sage considers increasing the price to see if the total income can be increased.
It is assumed that for each $1 increase in price, 6 fewer cartons will be sold.
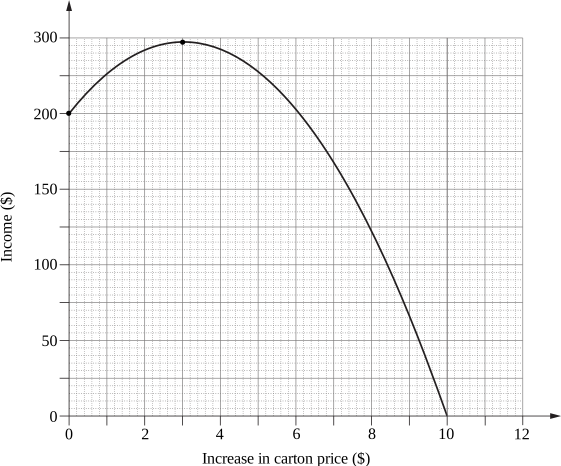
A graph showing the relationship between the increase in price per carton and the income is shown below.
--- 1 WORK AREA LINES (style=lined) ---
--- 1 WORK AREA LINES (style=lined) ---
The cost of running the market stall is $40 plus $1.50 per carton sold.
Calculate Sage's profit when the income earned from a day selling at the market is maximised. (2 marks)
--- 4 WORK AREA LINES (style=lined) ---
The brightness of a lamp \((L)\) is measured in lumens and varies directly with the square of the voltage \((V)\) applied, which is measured in volts.
When the lamp runs at 7 volts, it produces 735 lumens.
What voltage is required for the lamp to produce 1820 lumens? Give your answer correct to one decimal place. (3 marks)
--- 6 WORK AREA LINES (style=lined) ---
Taylor discovers that for a Spotted stingray, its mass is directly proportional to the square of its wingspan.
One Spotted stingray has a wingspan of 60 cm and a mass of 5400 grams.
What is the expected wingspan of a Spotted stingray with a mass of 9.6 kg? (3 marks)
--- 6 WORK AREA LINES (style=lined) ---
The stopping distance of a motor bike, in metres, is directly proportional to the square of its speed in km/h, and can be represented by the equation
`text{stopping distance}\ = k xx text{(speed)}^2`
where `k` is the constant of variation.
The stopping distance for a motor bike travelling at 40 km/h is 16 m.
--- 4 WORK AREA LINES (style=lined) ---
--- 2 WORK AREA LINES (style=lined) ---
An object is projected vertically into the air. Its height, \(h\) metres, above the ground after \(t\) seconds is given by \(h=-5 t^2+80 t\).
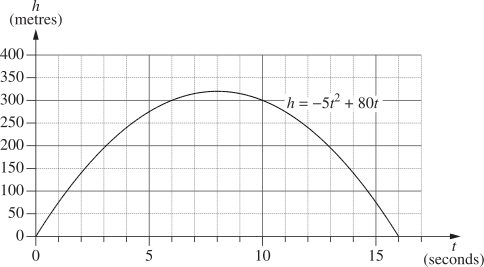
How far does the object travel in the first 10 seconds?
Which graph best represents the equation \(y = 2-x^2\) ?
| A. | 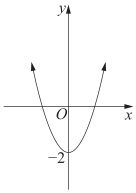 |
B. | 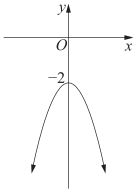 |
| C. | 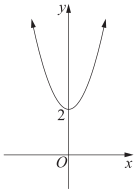 |
D. | 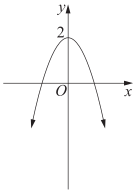 |